Displaying measured values
Valid for
|
GridVis Editions |
Software platform |
|
|
|

|
Position |
Description |
|
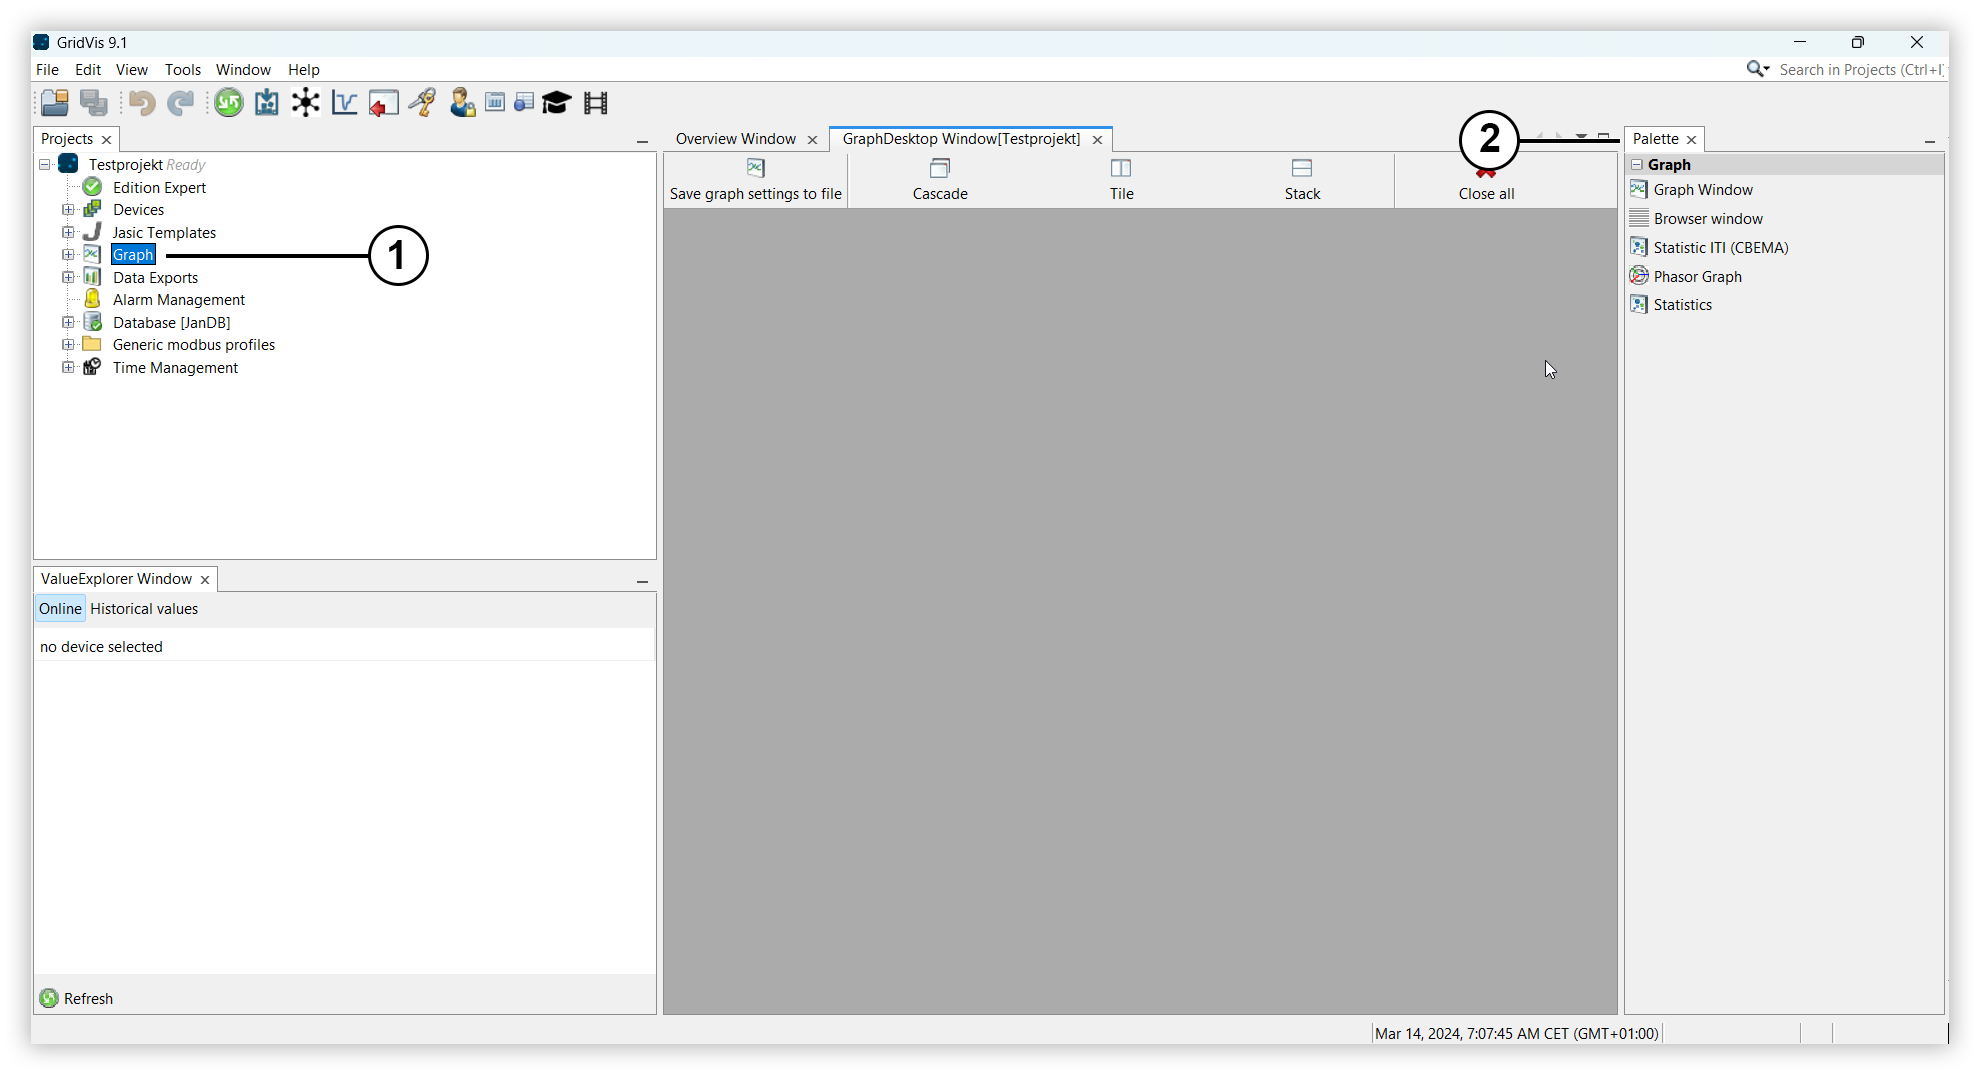
1 |
Use the Graph item in the project window to open the GraphDesktop window. Measured values can be displayed graphically here. |
|
2 |
Use the Palette window to select the display format for the measured values. Note If the window is not visible, open it via the tab Window > IDE Tools > Palette. |
Opening graphs
Open the project tree and click the item Graph. The GraphDesktop window opens.
Use drag and drop to drag one of the graphs from the Palette window into the GraphDesktop window.
Displaying measured value(s) in a graph
Depending on the graph, drag and drop measured values, groups of measured values or devices into the graph to visualize them:
Graph Window: Drag measured values or groups of measured values from the ValueExplorer window into the graph to display them as a line diagram. In the legend, you can right-click on a measured value to open the context menu and adjust the graph properties.
Browser window: Drag events, transients or sequences into the graph. The browser window displays the measured values in tabular form. Right-clicking or using the Show in graph button allows you to display the values graphically as well.
Statistic ITI (CBEMA): An explanation of the CBEMA curve can be found here: CBEMA curve
Phasor graph: Drag and drop a device into the phasor diagram or select Show phasor graph by right-clicking on the device in the project window. The phasor graph shows the phase angle and direction of the rotary field for the selected device.
Statistics: Drag historical measured values or groups of measured values from the ValueExplorer window into the graph. The values can be varied using the statistics properties in the window.
Save graph settings to file
Open a graph.
Drag the desired measured values or a device into the graph.
In the GraphDesktop window, click on the Save graph settings to file button.
Enter a name in the Filename field.
Select whether and for what period the values should be reloaded.
Online values: This selection has no function.
Historical values: The measured values are displayed for the selected period. With the setting Do not reload values when opened, the measured values currently displayed in the graph are saved in the file.
Confirm the selection with OK.
The saved graph setting is displayed in the Graph item in the project window as a file.