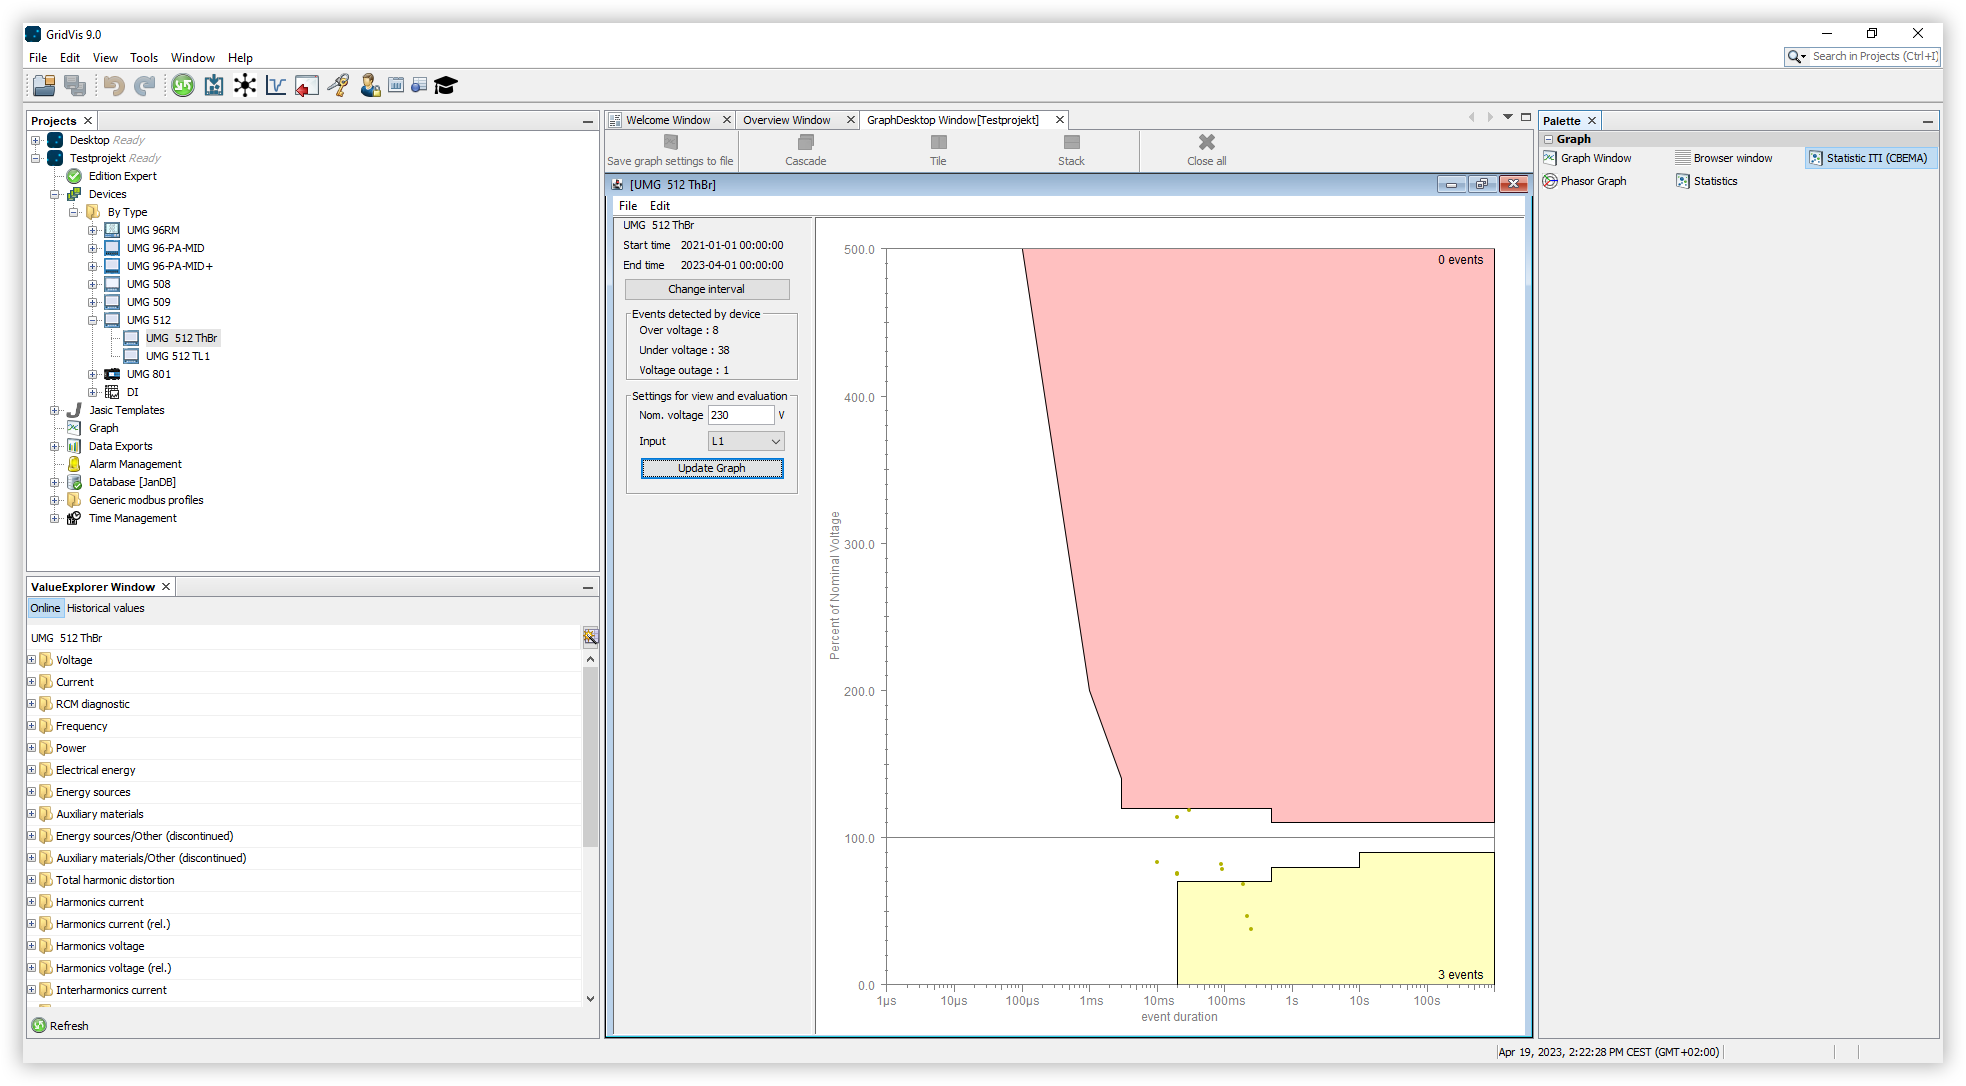
CBEMA curve
Open the project tree and click the item Graphs. The Graphs window
Drag the item ITI (CBEMA) Statistics into the Graphs Window using drag-and-drop.
Select the device you want to examine and drag and drop it from the project tree onto the CBEMA graph.
Click the Change Interval button and select the time period you want to examine.
In the Input drop-down menu, select the phase you want to examine.
Click the Update Graph button to display the result for the selected phase.
The CBEMA (Computer Business Equipment Manufacturers Association) curve or ITIC curve describes the maximum voltage deviation in relation to the event duration that electronic equipment must tolerate. The curve specifies permissible tolerances for evaluating the events, thus enabling an interpretation of the possible disturbances, and can be used as a standard for evaluation.
The vertical Y-axis for a point on the graph represents the voltage deviation (voltage failures, voltage dips or overvoltages) and this is linked to the duration as shown on the horizontal X-axis, thus providing a description of an event. These values should be within the permissible range of the CBEMA curve. Events within the colored areas are outside the tolerance range. Overvoltage (red area) can lead to a defect, undervoltage (yellow area) to a temporary failure of the device.