KPI Manager
Valid for
|
GridVis editions |
Software platform |
|
|
|

![]()
General description
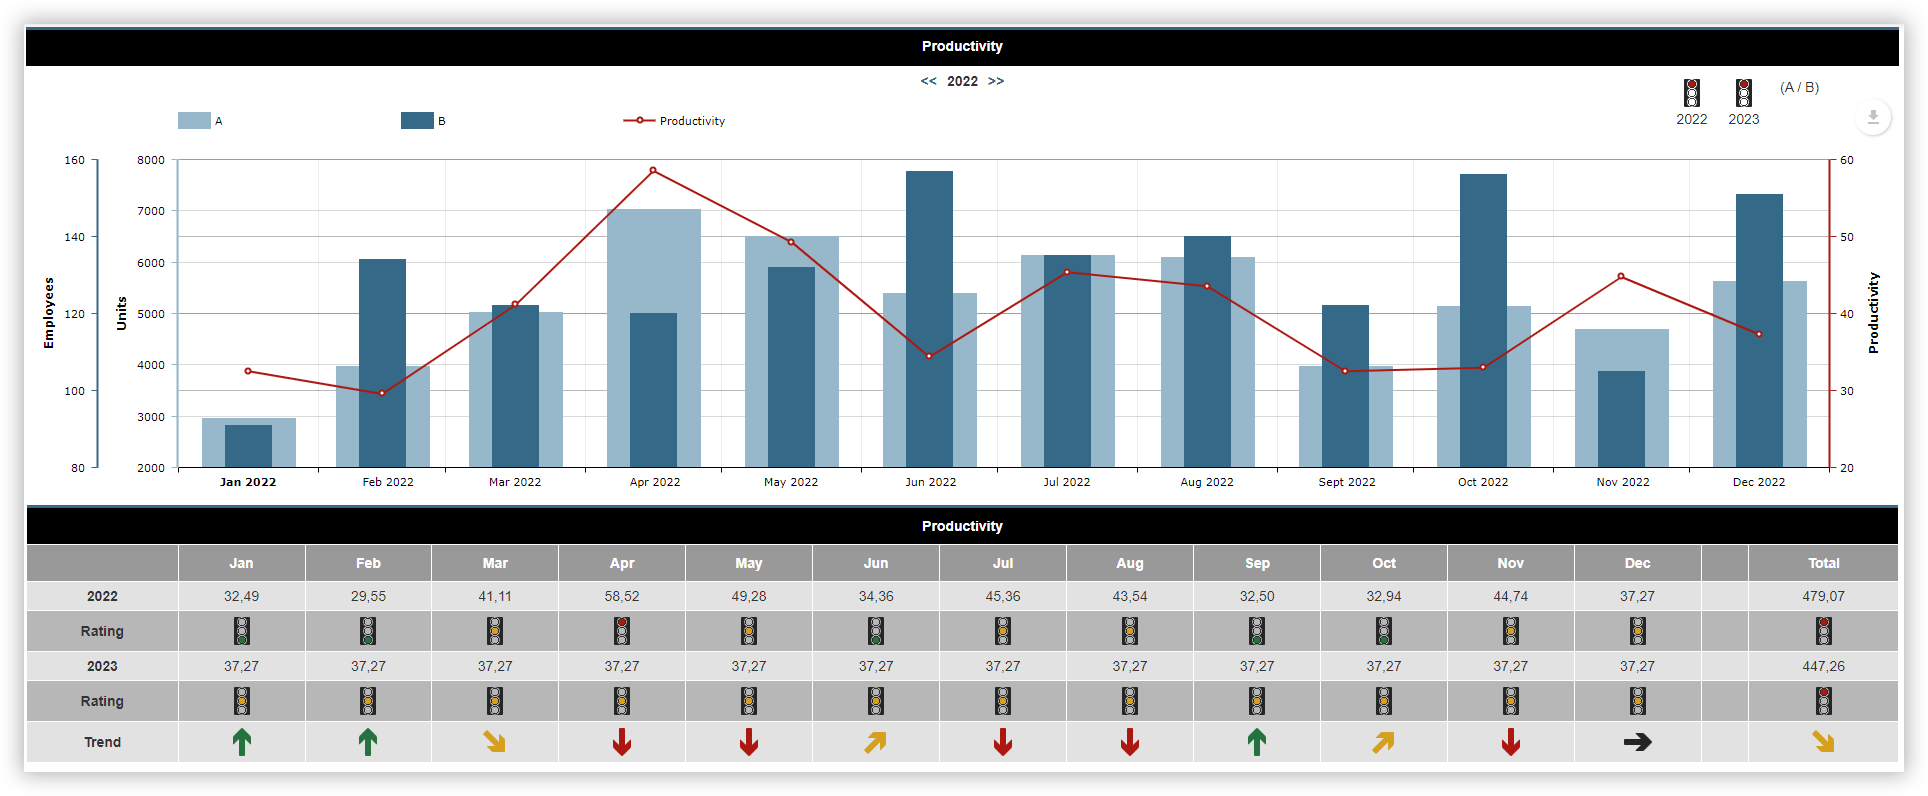
Key performance indicators can be used to compare consumption, economic or piece figures. Use the KPI Manager to create key performance indicators for your company. These key performance indicators can be displayed as KPI widgets in dashboards and reports in the form of charts and tables. Charts provide an overview of the key performance indicators and their operands, making causes and trends visible for changes. This allows assessments and reasons for change to be derived. You can find the KPI Manager at Configurators > KPI Manager.
|
Position |
Description |
|
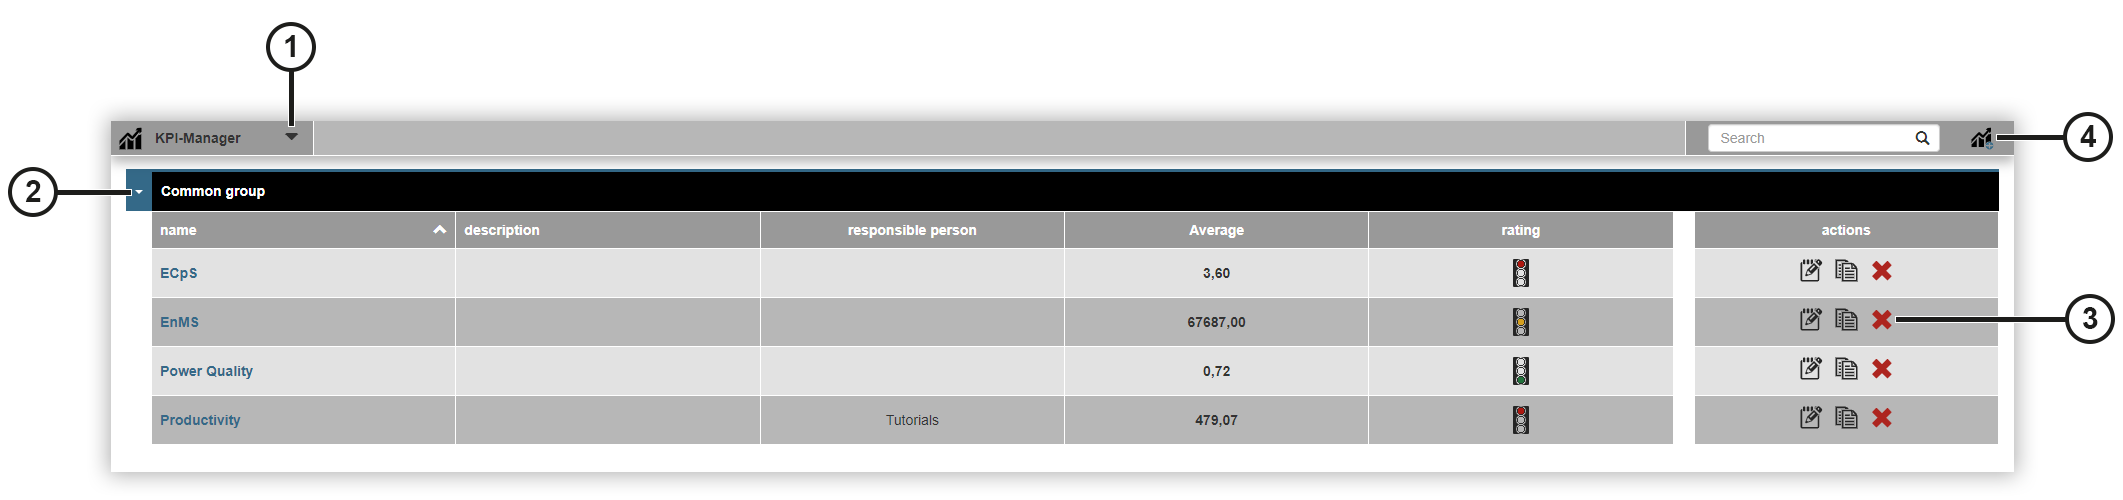
1 |
Selects the project. |
|
2 |
Displays the key performance indicators group with the associated key performance indicators and information. |
|
3 |
|
|
4 |
Opens the KPI Configurator Deletes the key performance indicator. |
KPI Configurator
The KPI Configurator consists of the following areas Settings , Evaluation and Trend und Preview . In the Settings area, enter the formula for your key performance indicator and other optional information. In the Evaluation and Trend area, define the evaluation levels and the trend for the key performance indicator. The Preview area shows a graphical representation of your key performance indicator, as well as the evaluation and the trend. Proceed as follows to add a new key performance indicator:
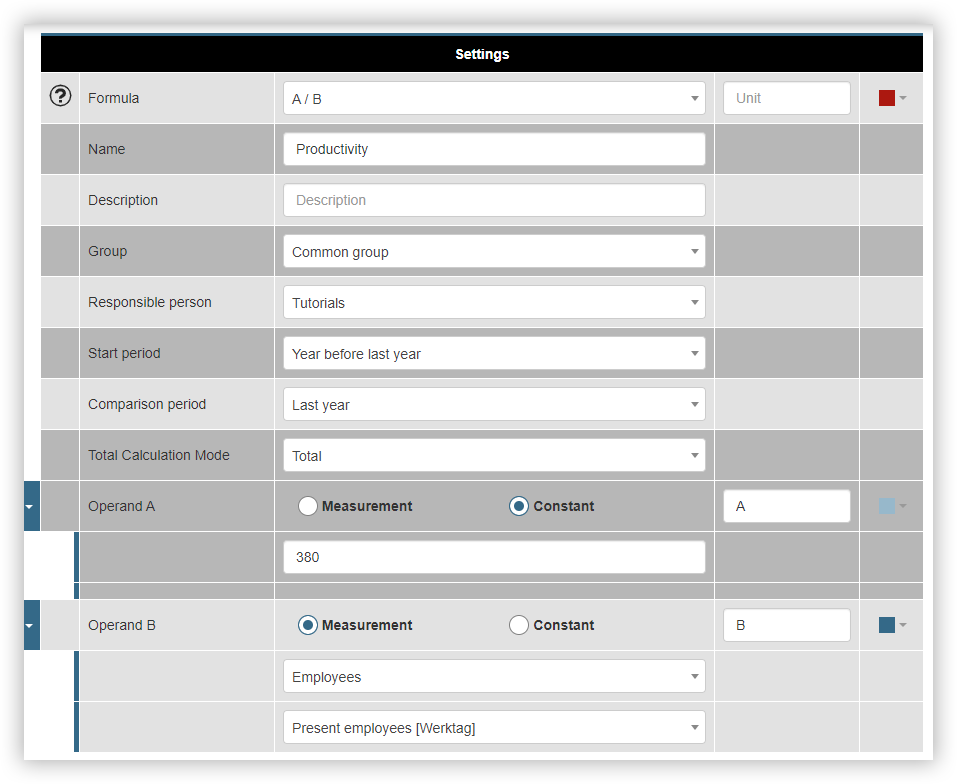
Settings
Click on the Add KPI
Select the formula for calculating the key performance indicator.
Name the key performance indicator.
Enter optional information such as the description, group and person responsible.
Select the period for which the key performance indicator is to be calculated. If you select Month, for example, daily key performance indicators are created. If you select Year, monthly key performance indicators are created.
Select the comparison period for the key performance indicator.
Define the operands for your key performance indicator. Depending on the formula, up to four operands can be selected. First select whether the operand is a measured value or a constant. Then name the operand.
If it is a measured value, first select the measurement device and then the measured value.
Finally, click on the Save KPI The Evaluation and Trend window opens.
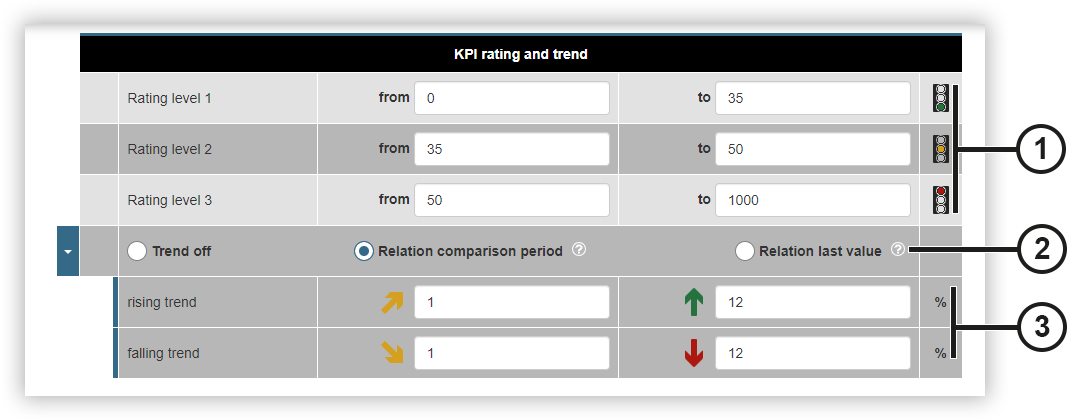
Evaluation and Trend
The evaluation levels are displayed using an indicator in the form of a traffic light. Arrows are used to show rising and falling trends.
|
Position |
Description |
|
1 |
Defines the evaluation levels for your key performance indicator.
|
|
2 |
Defines how the trend is determined.
|
|
3 |
Defines how the development of the trend is displayed.
|
Preview
The Preview area shows a graphical representation of your key performance indicator with the associated operands. If your key performance indicator is not displayed as expected, you can change your entries in the Settings and Evaluation and Trend areas. If your key performance indicator is displayed as expected, click on the Back button to save the key performance indicator. You will then be returned to the overview of all your key performance indicators.