Sankey Manager
Valid for
|
GridVis editions |
Software platform |
|
|
|

![]()
General description
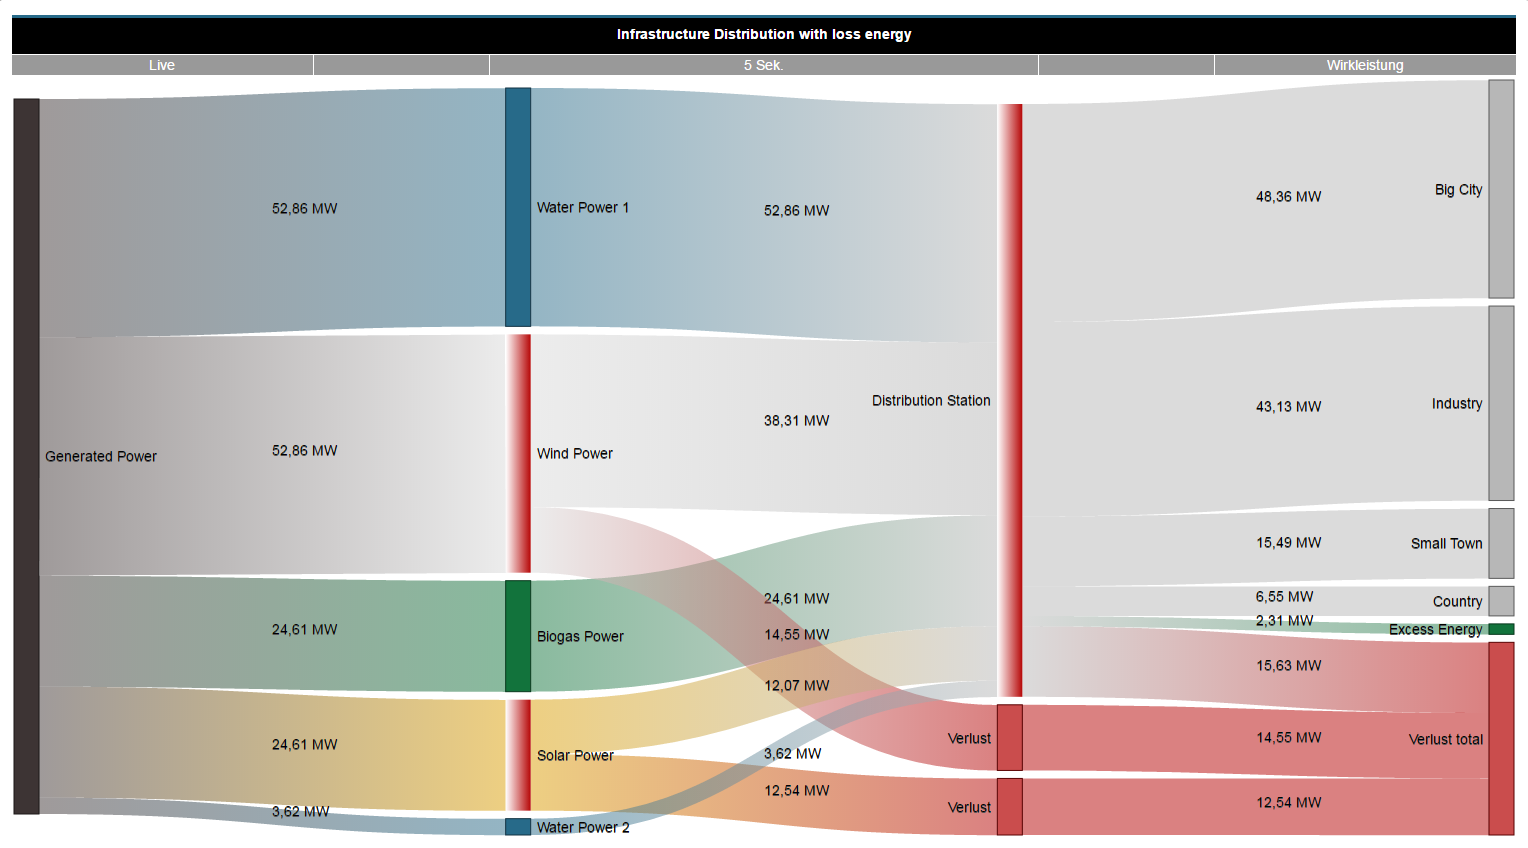
Energy flow analyses require relevant energy consumption values, which are prepared in the form of Sankey diagrams. Sankey diagrams offer a transparent and clear presentation of energy consumption and other measured values.
|
Position |
Description |
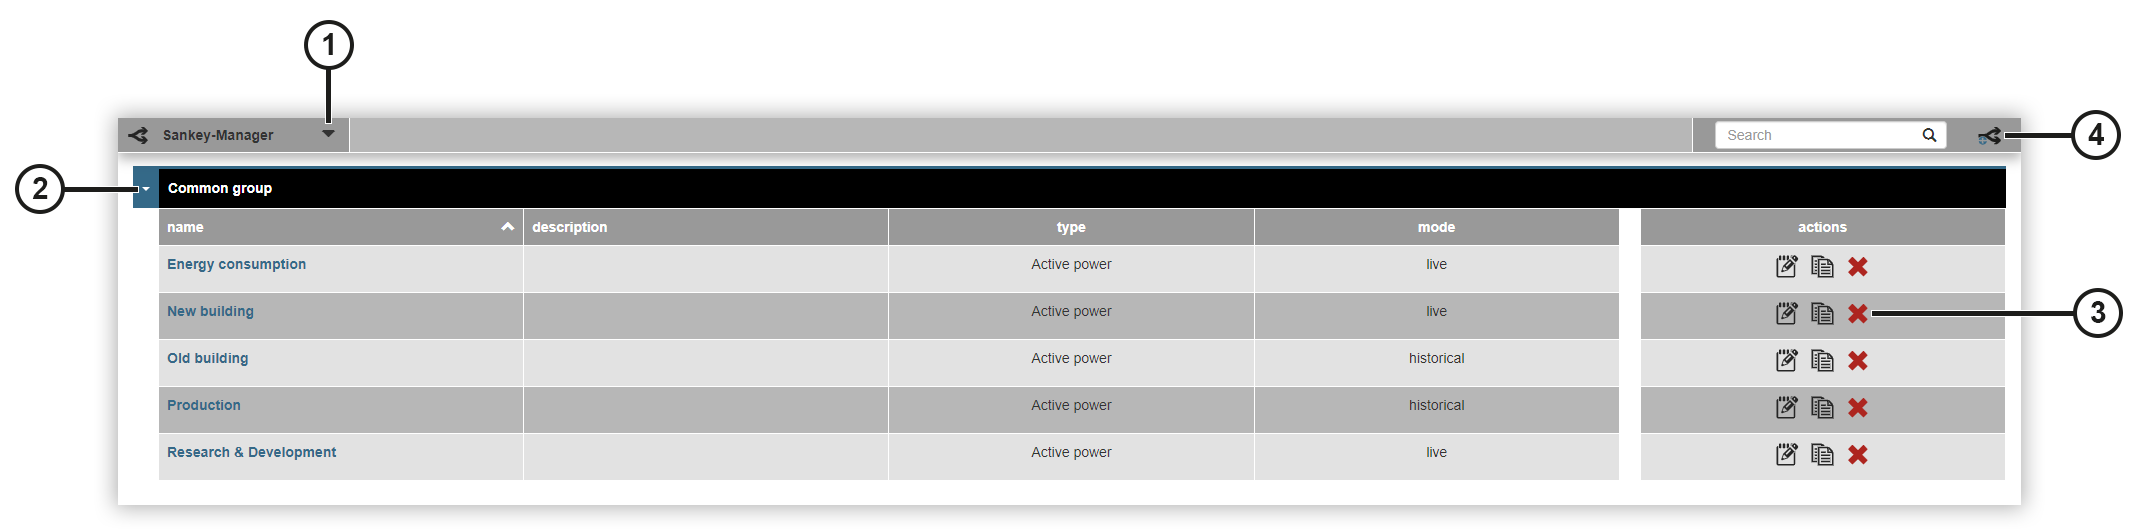
|
1 |
Selects a project. |
|
2 |
Displays a group with the associated Sankey diagrams and information. |
|
3 |
|
|
4 |
Opens the Sankey configurator and adds a new Sankey diagram. |
The Sankey configurator
The Sankey configurator consists of the following areas Settings , Nodes , Connections und Preview . In the Settings, select whether the Sankey is to be created with live or historical values and enter further information. In the Nodes area, assign a node type to your measurement devices and measured values. In the Connections area, configure the start and target nodes. In the Preview area, you will then see the graphical representation of the Sankey diagram. Proceed as follows to create a Sankey diagram:
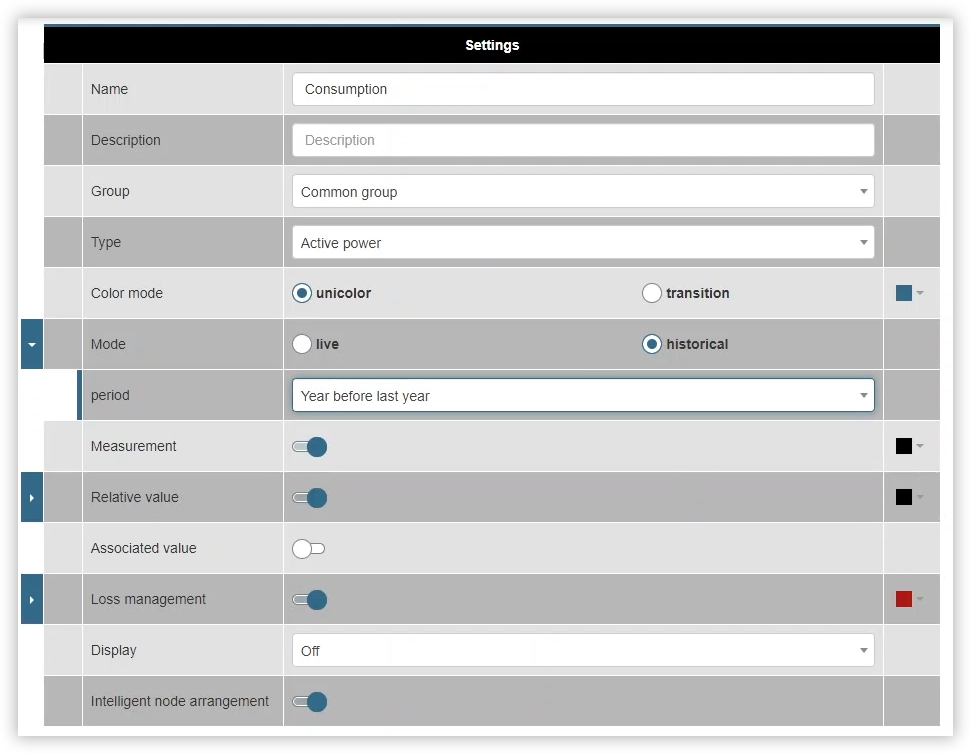
Settings
Click the Add Sankey button.
Name the diagram and enter optional information such as the description and group.
Select the type of Sankey.
Select whether the Sankey should be displayed in one color or with color transitions.
Select the time mode and then the time period.
Select whether information such as the measured value, relative measured value, the accompanying value or the Lost management should be displayed as a tooltip above a connection when a mouse-over is performed.
The relative value presents the measured value as a percentage as well.
The accompanying value is the measured value multiplied by a factor and a unit.
Select whether the nodes should be arranged intelligently.
The intelligent node arrangement optimizes the positioning of the nodes to minimize flow crossovers, ensure a logical flow direction and to group related nodes. This makes the diagram clearer and easier to understand.
Then click the Save Sankey button to go to the Nodes area.
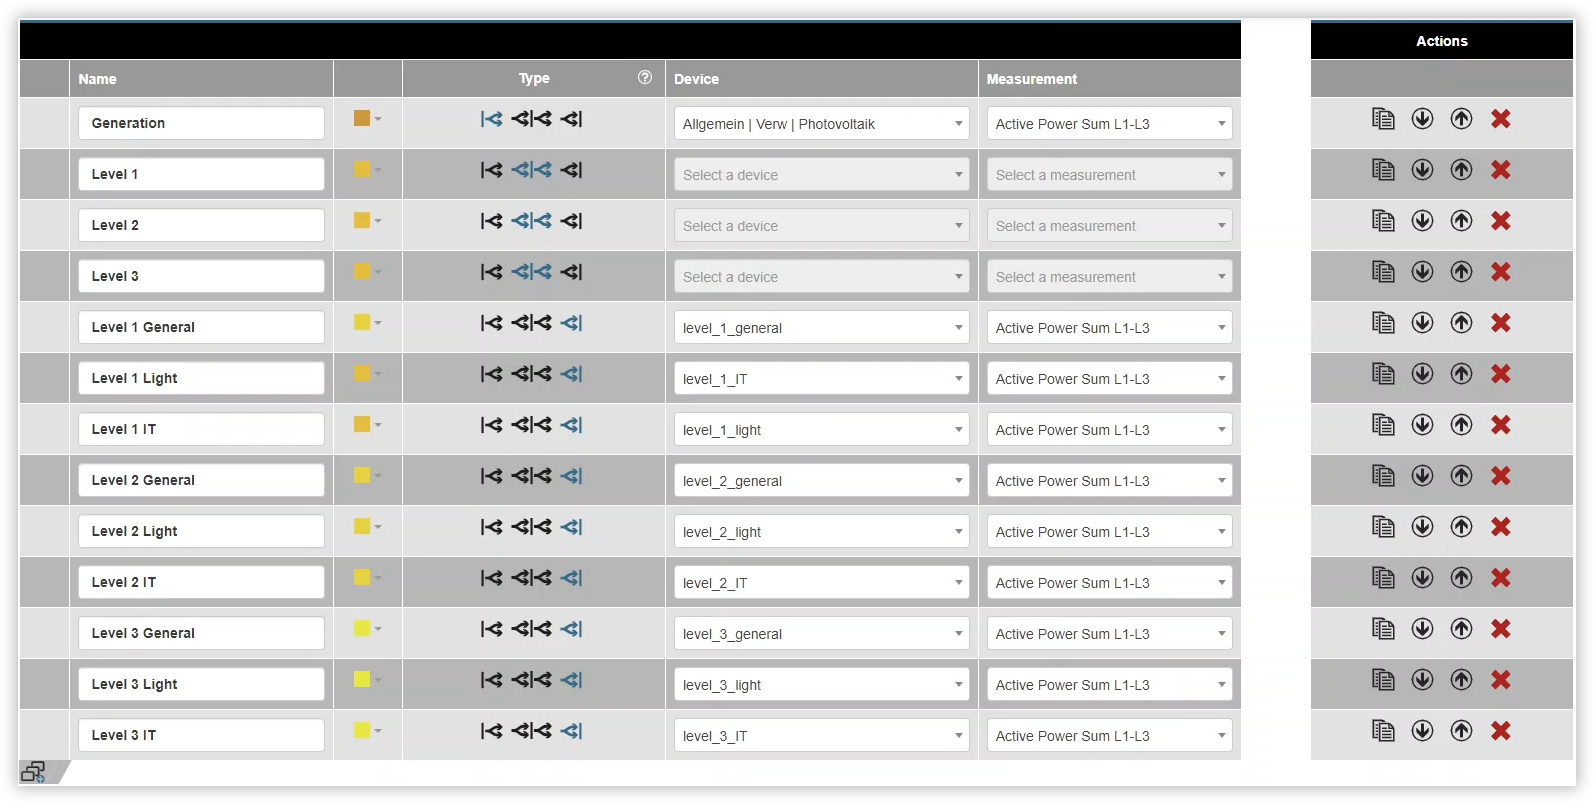
Nodes
The Nodes area is used to define the start and target nodes with the associated measurement devices and measured values. Proceed as follows to define your nodes:
Name the node.
Select the node type. Please note that nodes are not measured values. A distinction is made between three types of node:
Start nodes: Only have output connections.
Intermediate nodes: Can have multiple input and output connections.
Target nodes: Only have input connections.
Select the Measurement device for the node.
Select the Measured value for the node.
If necessary, click the Add node button to define further nodes.
Click the Save Sankey button to go to the Connections area.
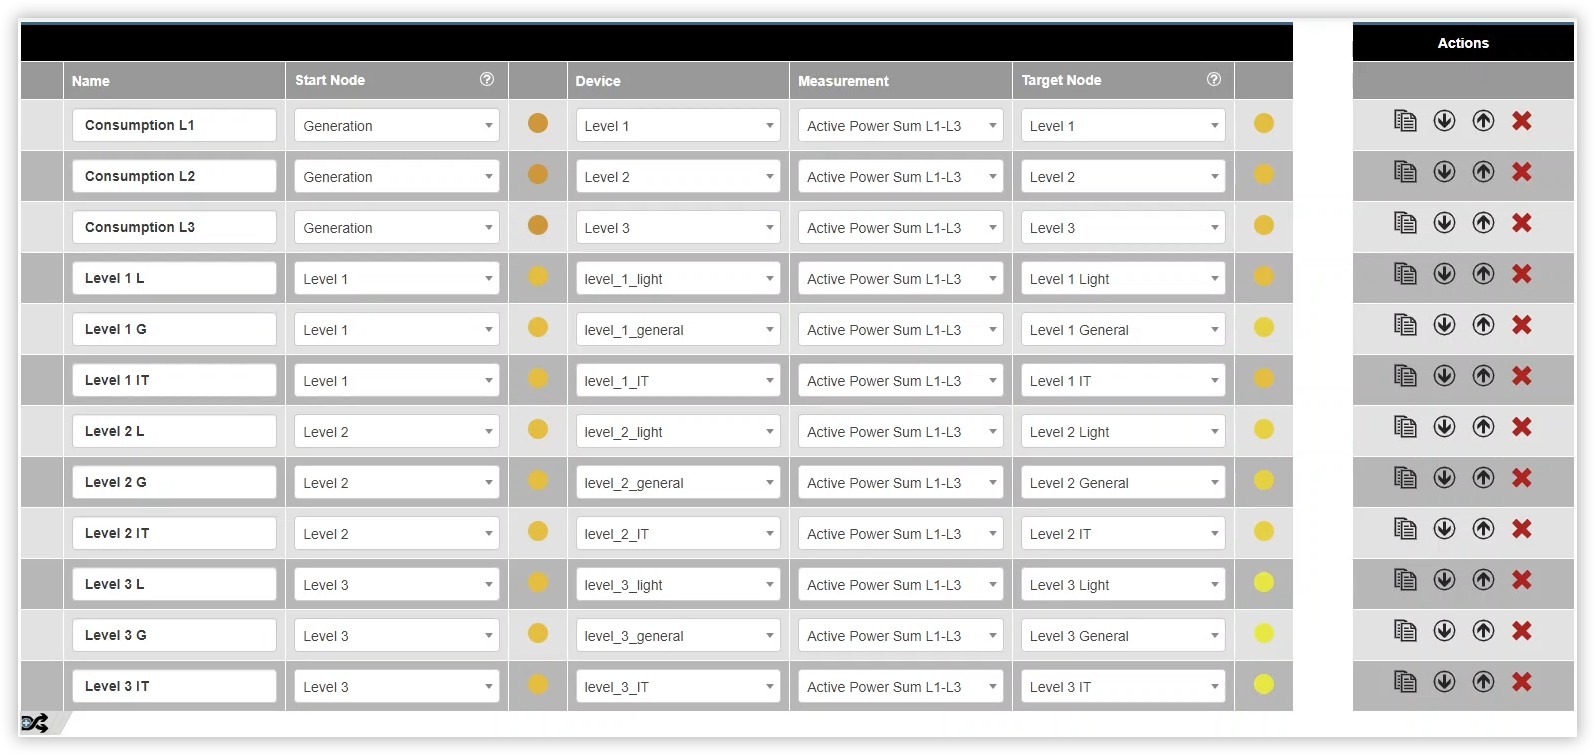
Connections
A connection is used to link two nodes together. The surface area of a connection illustrates the size ratio of the measured value to the entire plane. Proceed as follows to configure the connections:
Name the connection.
Select the start node for the connection.
Select the measurement device.
Select the measured value.
Select the target node for the connection.
If necessary, click the Add connection button to define further nodes.
Click the Save Sankey button to go to the Preview section.
Note
If no measurement devices are available, you can also use virtual measurement devices (VD) . These VDs can be created in GridVis Desktop. However, only measurement devices from the declared main project can be selected.
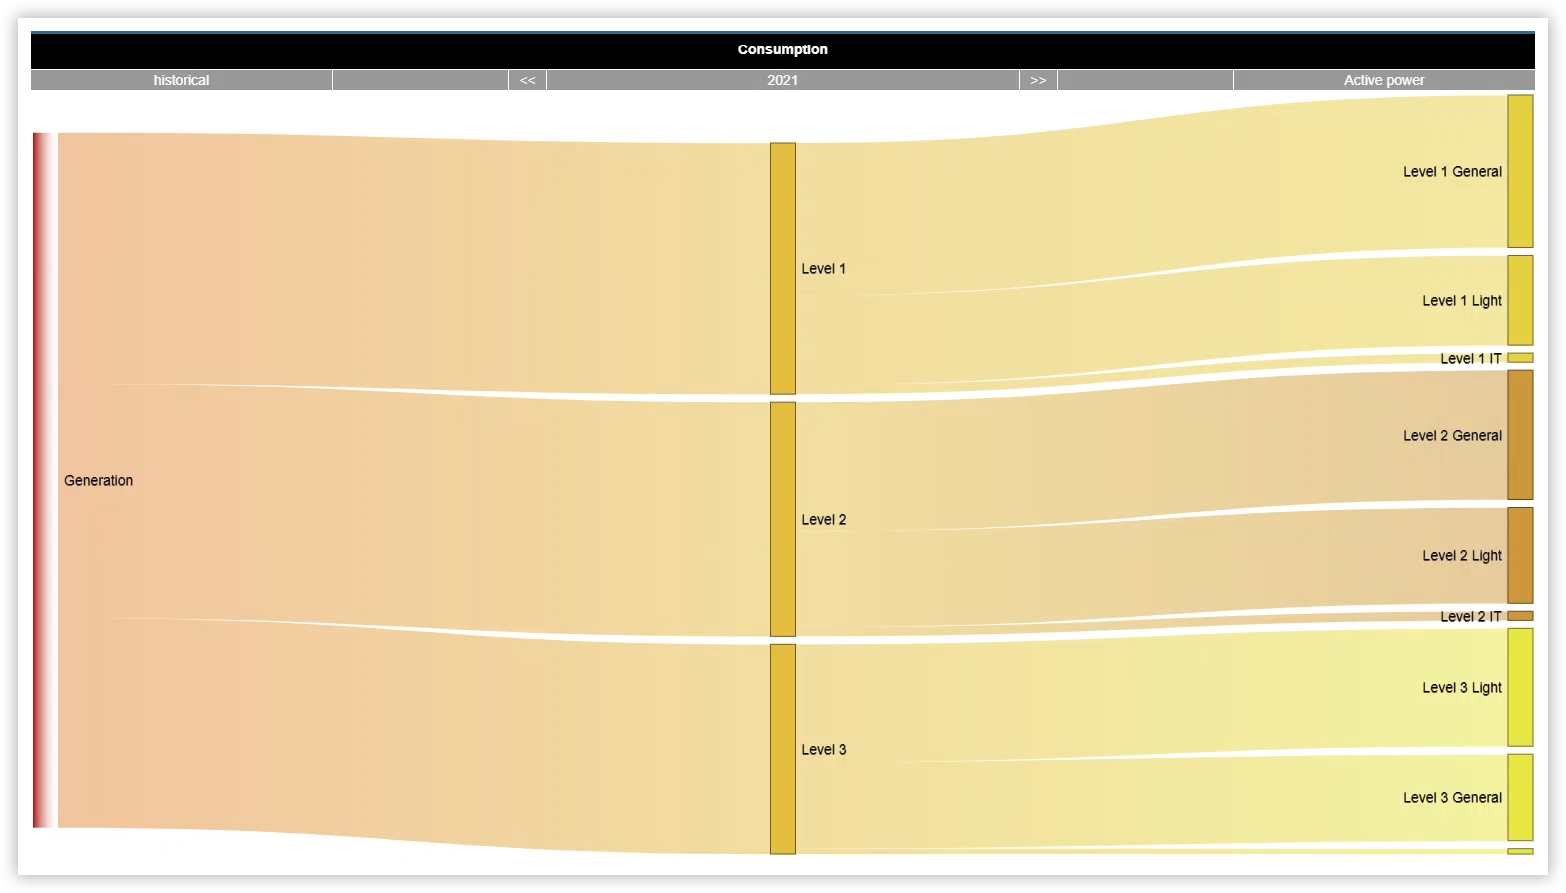
Preview
The Preview area shows a graphical representation of your Sankey. If your Sankey is not displayed as expected, you can change your entries in the Settings , Nodes , and Connections areas. If your Sankey is displayed as expected, click the Back button to save the Sankey. This will then take you back to the overview of all Sankey diagrams.
Loss management
The Loss management indicates the difference between the input and output values of a node. If a tolerance limit is exceeded, the losses are highlighted in the Sankey diagram. These can be input or output losses. The losses are color-coded and have a color gradient towards white. Losses usually indicate connection or configuration errors and therefore also serve as a plausibility check of the configuration. The Loss management can be configured in the Settings of the Sankey Manager.
Input losses: Color gradient from white to a solid color
Output losses: Color gradient from a solid color to white