Debug log
In debug mode, a JASIC program which has been transferred to a device can record and output debugging information, using the log function for example.
Example:
Create a program in the graphic JASIC environment using the Log function .
Transmit the program to the JASIC environment using the Transmit to... button.
Select an active device and an available location in the program and end the action with Finish.
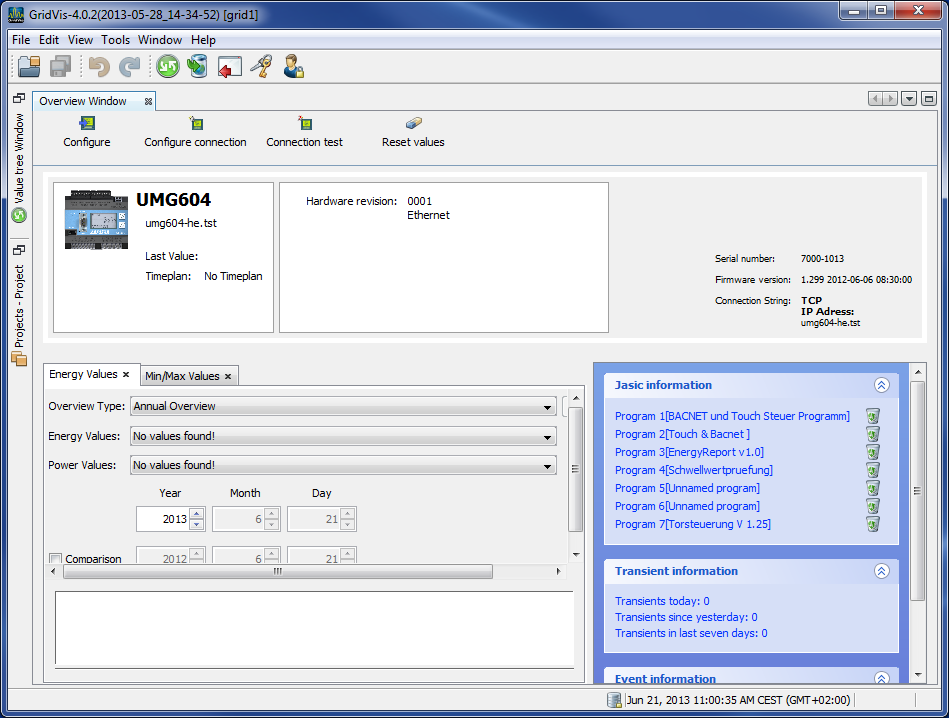
Open the Overview window and select the device in the Projects window.
By selecting the program just transmitted in the Jasic information area , it is loaded into the GridVis and displayed in another program window.
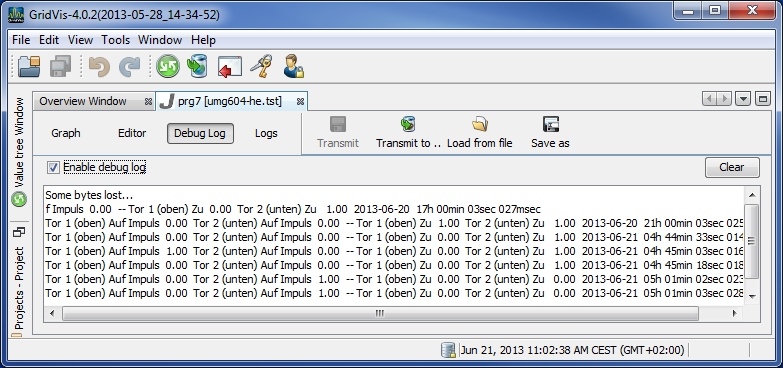
Select the Debug log button in the program window and start the debugging information by clicking the Enable debug log button.
Debug buttons
Empty: This deletes the contents of the Debug window.
Enable debug log : The debugging information is displayed or disabled via this button.