RCM report
RCM report - Example
Valid for
|
GridVis editions |
Software platform |
|
|
|

Description
You can analyze and evaluate residual current violations with the RCM (residual current monitoring) report. You receive critical statistics regarding threshold violations with general and graphically highlighted overviews. The function RCM Report includes:
The setting of up to 4 threshold levels.
The support of dynamic thresholds (RCM measuring devices).
The optimized report for residual currents (L5, L6, UMG 20CM)
The visual highlighting of the overall result.
The choice between 2 design templates and export in PDF and XLS formats.
Note
To configure your RCM report, you need the recorded values (historical values) from your RCM-capable measuring device. Check the user manual of your meter to see whether it is RCM-capable.
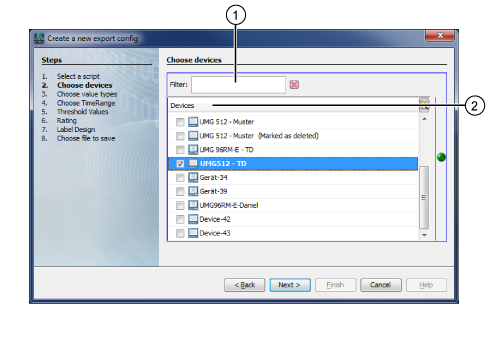
Step Select Devices:
|
Pos. |
Description |
|
1 |
Search and sort filter function. Useful for larger numbers of measuring devices (measurement sites). |
|
2 |
Devices with a marked checkbox are included in the evaluation (report). |
Hinweis
Depending on the device type, based on the available values, the RCM data export decides whether a device can provide RCM or not. If in the device selection devices of the above supported device types are missing, they have most likely not yet been synchronized. After a synchronize, they should be visible in the device selection window of the data export.
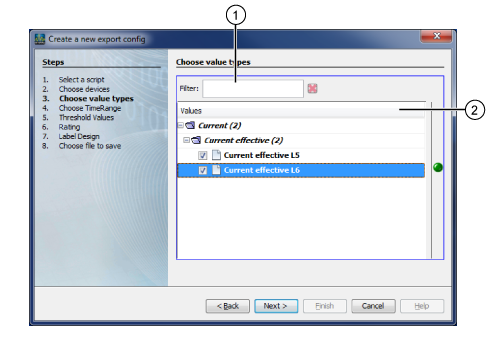
Step Selection of Value Types (Measurement Value Selection):
|
Pos. |
Description |
|
1 |
Search and sort filter function. |
|
2 |
Value types (measurement values) with a marked checkbox are included in the evaluation (report). For the RCM report, the value types: Effective current L5, and L6. |
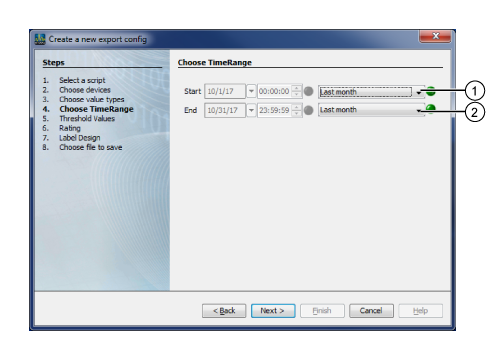
Step Selection Time Range:
|
Pos. |
Description |
|
1 |
Configure the starting time of the evaluation period for your RCM report with the option lists. Option lists appearing in Blue show the valid evaluation periods. |
|
2 |
Configure the stopping time of the evaluation period for your RCM report with the option lists. Options lists appearing in Blue show the valid evaluation periods. |
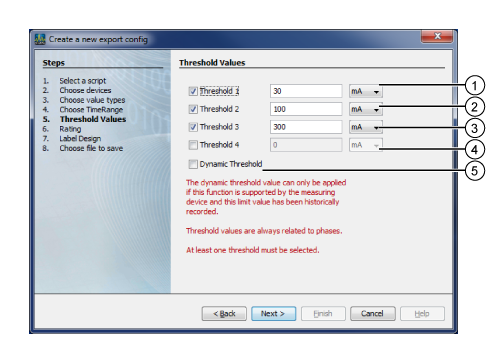
Step Thresholds:
|
Pos. |
Description |
|
1 |
Preset:
|
|
2 |
Preset:
|
|
3 |
Preset:
|
|
4 |
Preset:
|
|
5 |
Preset:
Note Thresholds are taken from recordings (historical values)!
Only measuring devices that record the dynamic threshold historically can support the function of the dynamic threshold. |
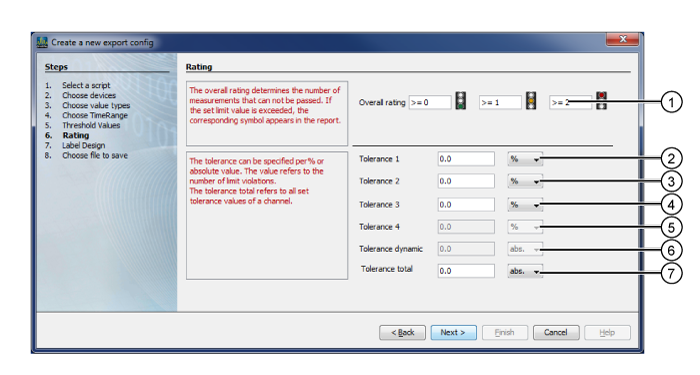
Step Evaluation
|
Pos. |
Description |
|
1 |
The overall evaluation shows the number of measurement points (measurements) with threshold violations. Depending on the set number of measurement points (measurements), the corresponding traffic light will appear in the RCM report.
Presets (Example: Traffic Light Evaluation):
|
|
2 |
You can configure the tolerance as a relative value (%) or an absolute value. The value is based on the number of threshold violations. Preset:
|
|
3 |
You can configure the tolerance as a relative value (%) or an absolute value. The value is based on the number of threshold violations. The entry of the value is active if in the step Thresholds, the checkbox Threshold 2 was marked. Preset:
|
|
4 |
You can configure the tolerance as a relative value (%) or an absolute value. The value is based on the number of threshold violations. The entry of the value is active if in the step Thresholds, the checkbox Threshold 3 was marked. Preset:
The entry of the value is active if in the step Thresholds, the checkbox was marked. |
|
5 |
You can configure the tolerance as a relative value (%) or an absolute value. The value is based on the number of threshold violations. The entry of the value is active if in the step Thresholds, the checkbox Threshold 4 was marked. Preset:
The entry of the value is active if in the step Thresholds, the checkbox was marked. |
|
6 |
You can configure the tolerance as a relative value (%) or an absolute value. The value is based on the number of threshold violations. The entry of the value is active if in the step Thresholds, the checkbox Dynamic Threshold was marked. Preset:
|
|
7 |
You can configure the tolerance as a relative value (%) or an absolute value. The Total Tolerance is based on the number of all threshold violations of a measurement value. Preset:
|
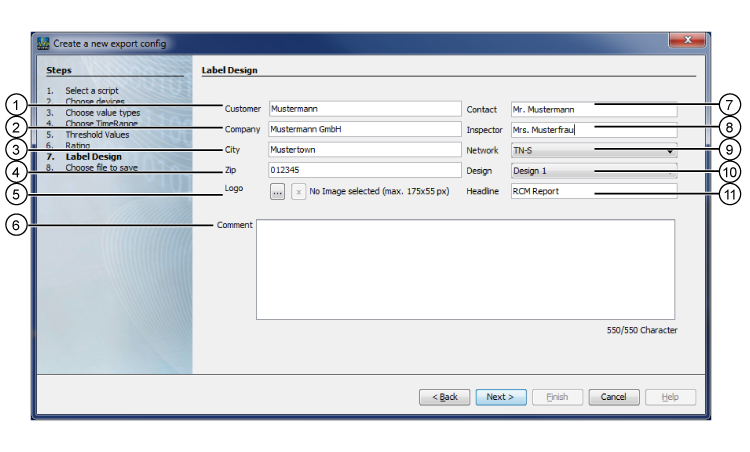
Step Labeling and Design
|
Pos. |
Description |
|
1 |
Entry Client |
|
2 |
Entry Company |
|
3 |
Entry City |
|
4 |
Entry Postal code |
|
5 |
|
|
6 |
Entry of a comment |
|
7 |
Entry Name of Contact Person |
|
8 |
Entry Name of Examiner |
|
9 |
Preset: TN-S Further settings: TT, TN-C-S, Other |
|
10 |
There are 2 design templates (layouts) available for RCM reports. |
|
11 |
Entry of a headline. |
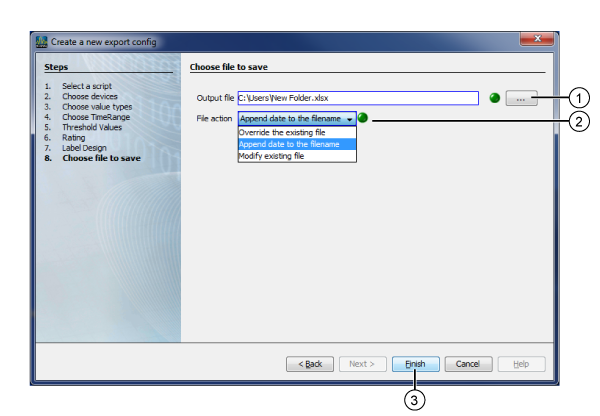
Step Select File to Save
|
Pos. |
Description |
|
1 |
Entry field for the path of the save location of your RCM report. Click on the button "..." to select the save location and the file format (xlsx, xls or pdf) of your RCM report. Note The xlsx and xls export is optimized for the current Microsoft Excel application! Correct display in other applications is not guaranteed! |
|
2 |
Overwrite Existing File - Overwrites the existing RCM report. Add Date to the File Name - Creates another RCM report. Change Existing File - |
|
3 |
Single-click to open the dialog box Entry of the Name for the Export Script. Your configured RCM Report appears under the entry Data Exports in the Projects window of the GridVis. |
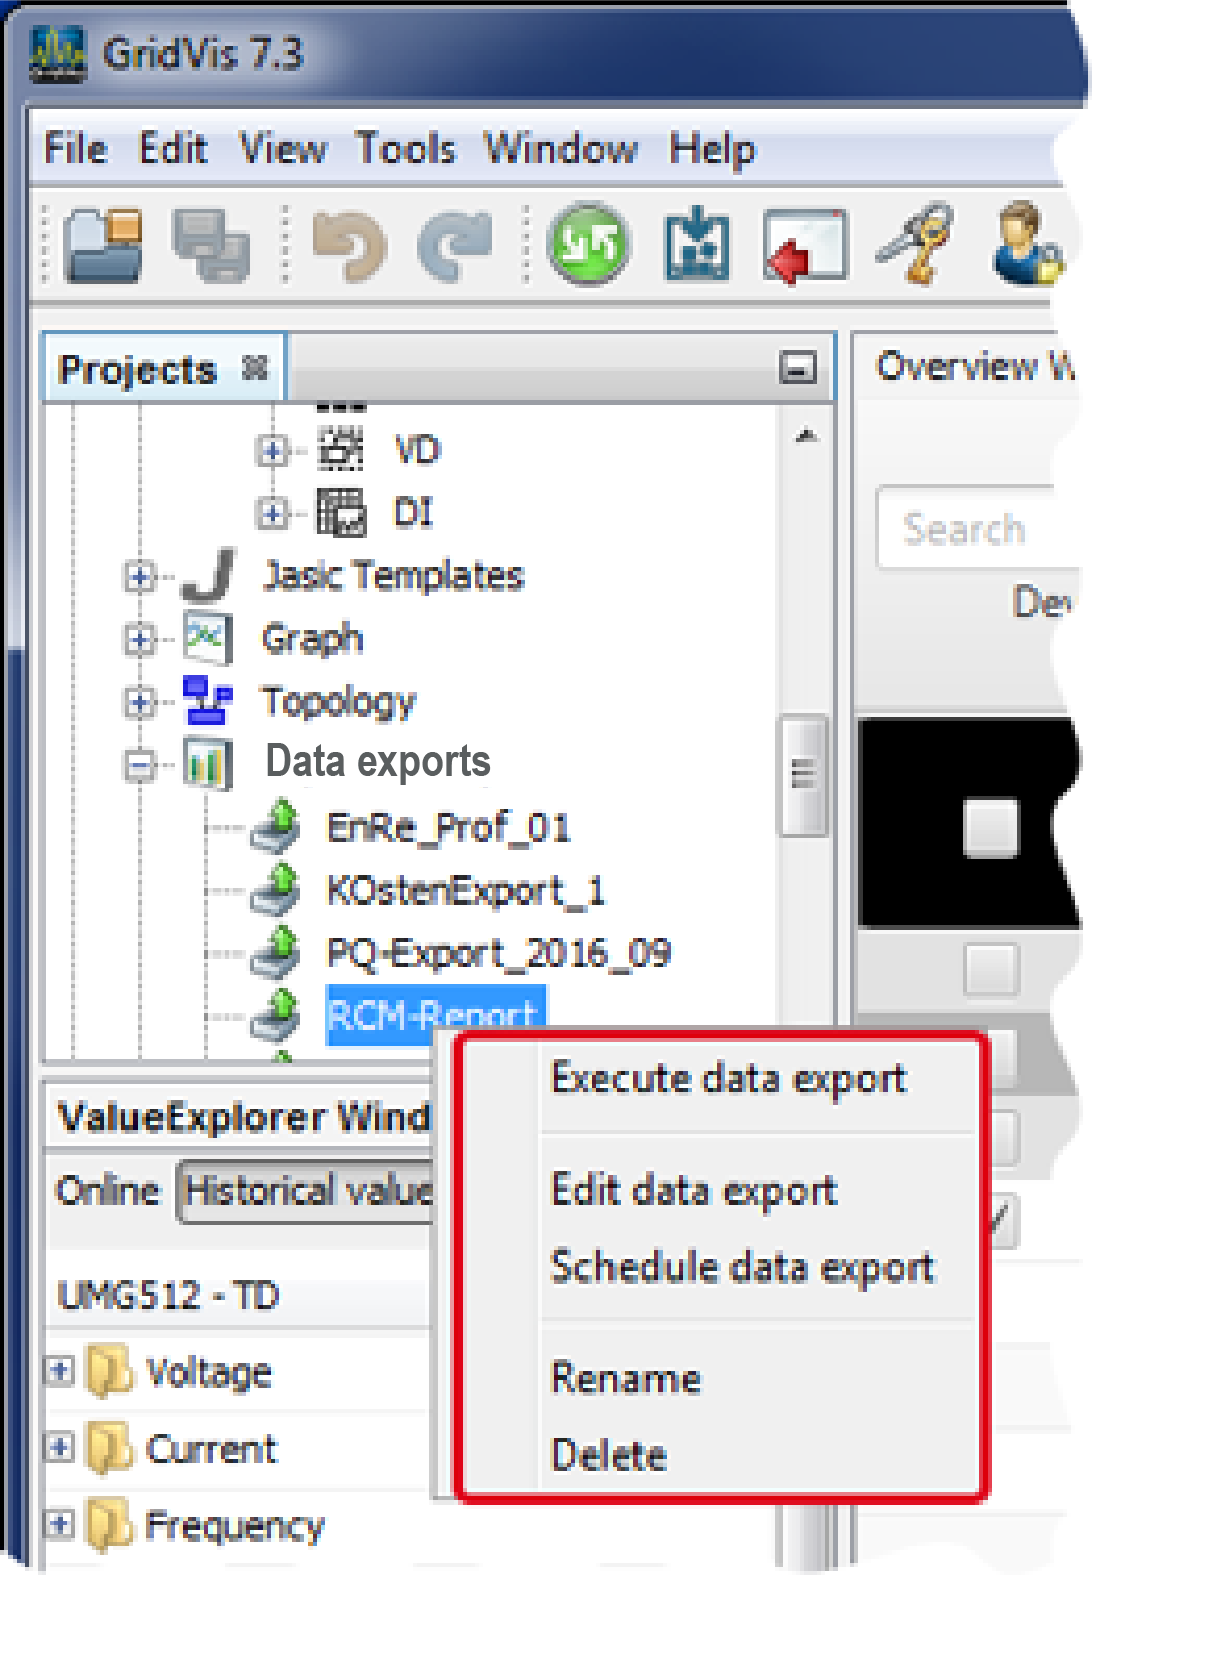
Execute RCM report (data export):
Right-click on the configured RCM export in the directory Data Exports of the Projects window to open the context menu with the following functions:
|
Description |
|
Single-click on the entry Execute Data Export to initiate the action. This is accompanied by a non-defined progress bar in the status bar of the GridVis interface. Double-clicking on the previously created RCM Report in the directory Data Exports in the Projects window will also start a data export. Depending on the configuration of the step Select File to Save your RCM report will be available as a xlsx, xls or pdf file in the selected directory. |
|
Single-click on the entry to enter the configuration of your data export (Edit Data Export window). |
|
Single-click on the entry to enter the dialog Schedule Configuration. |
|
Single-click on the entry to enter a dialog box. change the name for your RCM Report in the entry field and confirm with OK. |
|
Single-clicking on the entry deletes your RCM Report via a dialog box. |