Visualize Online Values in Graphs
Description
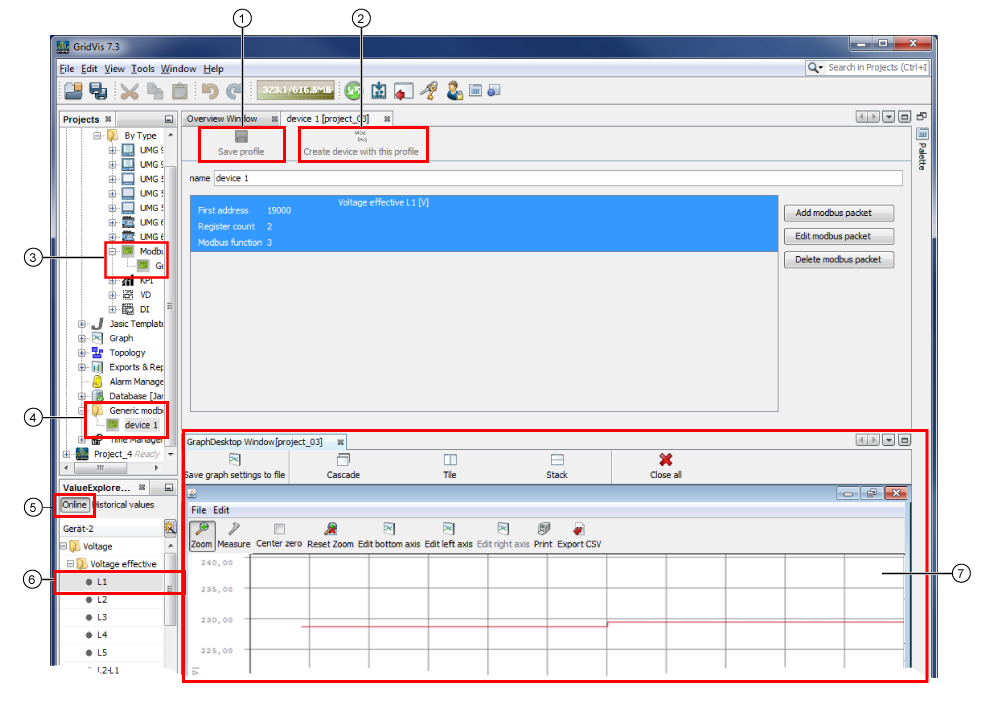
You can visualize the measurement values of a generic Modbus device in a graph through the online values in the value tree window (drag-and-drop).
Various diagnostic options for the measurement values result from the visualization in graphs..
You can also document e.g. your graph images with a CSV Export or the function Print.
|
Pos. |
Description |
|
1 |
Saves the Modbus packages you created in the generic Modbus profile (Pos. 4). |
|
2 |
Creates a new device with the generic Modbus profile that was created (Pos. 3). Cf. step Configure Connection. |
|
3 |
Measuring devices created with generic Modbus profiles. |
|
4 |
Created Generic Modbus profile. |
|
5 |
All of the online measurement values (in directories) appear in the value tree window. |
|
6 |
Online measurement value that can be visualized in the graph. Pull the respective online measurement value using drag-and-drop into the window of the graph. |
|
7 |
Shows the online measurement values in the graph visualization. You can configure the scaling factor (resolution of the measurement value) in the graph visualization in the Modbus Value List. |