Key Performance Analysis
Valid for
|
GridVis edition |
Software platform |
|
|
|

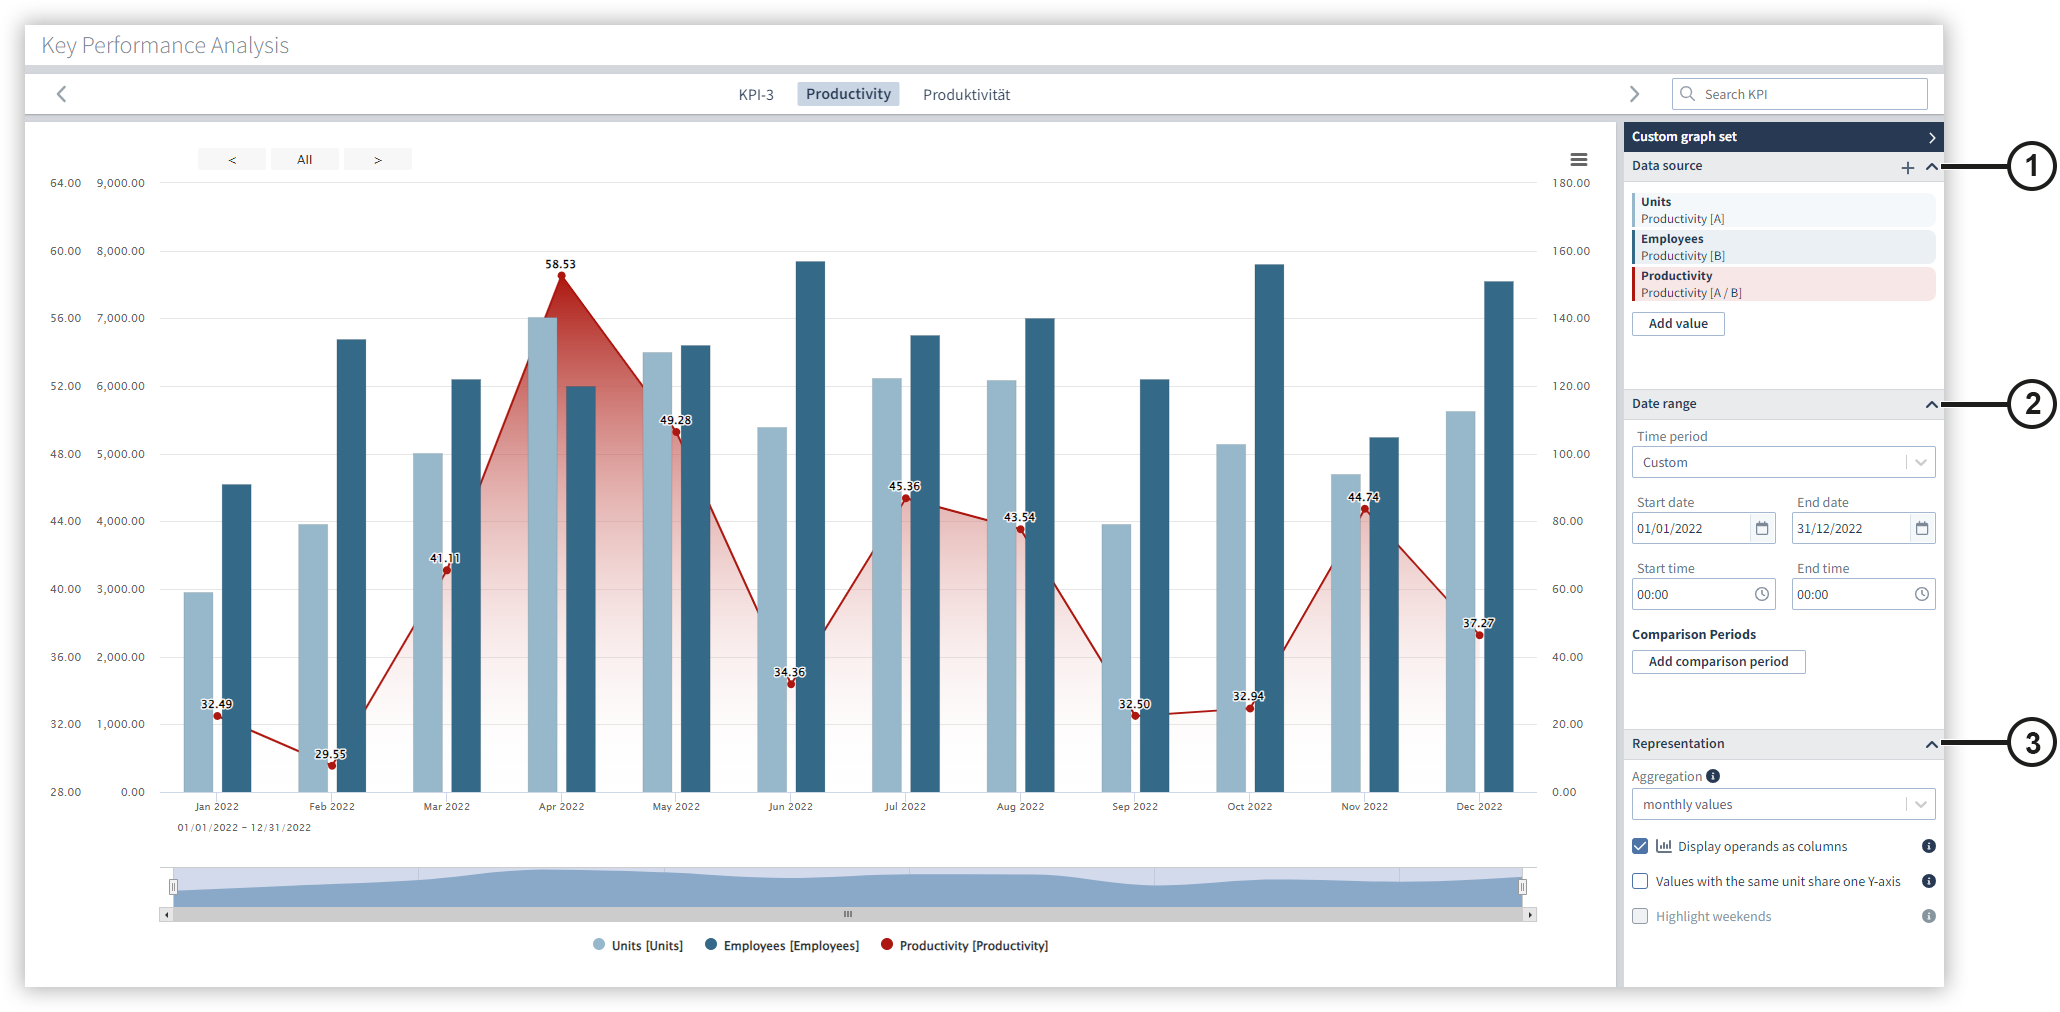
With the KPI analysis, all created KPIs can be evaluated across all projects in a graph function. You can switch between your KPIs in the view and compare KPIs from different calculations. Please note that you must first create your KPIs in the KPI Manager. A large number of different formulas and variables are available to you.
|
Position |
Description |
|
1 |
Displays the selected key figures with display name, formula and color. Move the mouse over a key figure to edit or remove it. You can add new key figures by clicking on the + symbol. In the subsequent value selection, you can choose whether only individual variables or the overall result should be displayed. |
|
2 |
Make settings here for the start and end time, as well as for the comparisons. You can add up to two comparison periods. In contrast to the KPI Manager , you can freely set the time period for the key figure analysis and thus use individual time periods. The key figures are then calculated for the corresponding period. |
|
3 |
Make settings for the display and aggregation of the measured values here. Note that the measured values can only be displayed as columns if all measured values have the same aggregation period. Note that the weekends can only be highlighted if all measured values use an aggregation period of one week or less. |