Event Browser
Analyzing Events and Transients
Filtering Events and Transients
Adjusting Event and Transient List
Valid for
|
GridVis editions |
Software platform |
|
|
|

![]()
Short-term interruptions, overcurrents and transients can impair electrical systems and electronic components. If something goes wrong, finding the cause or source of the error quickly and safely is critical.
As part of GridVis, the Event Browser provides you with a quick overview through graphical analyses of recorded events and transients.
You will obtain an overview of the functions of the GridVis Event Browser on this page.
Note
To analyze events and transients in the Event Browser, configure the recording settings of your measurement devices accordingly.
Call up
You reach the Event Browser in the GridVis Web via the navigation menu and in the GridVis Desktop via the Event Browser icon in the toolbar.
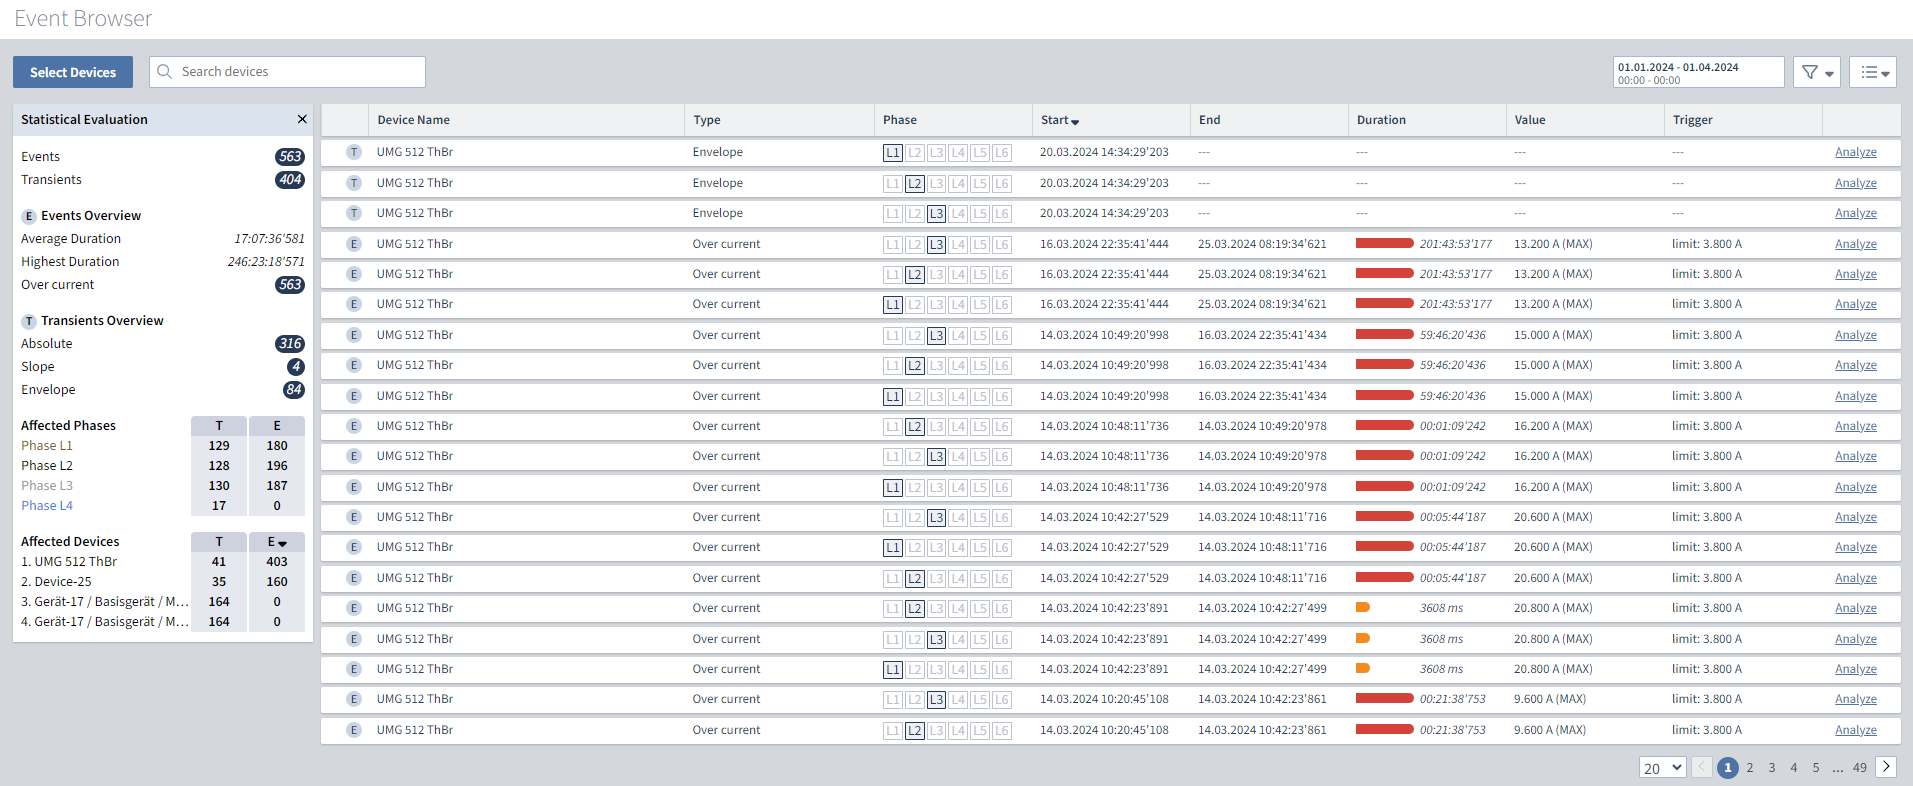
When you first open it, you are automatically taken to the device selection. The device selection lists all devices available in your projects that can record events and transients.
After selecting the devices, the Event Browser opens in the List view .
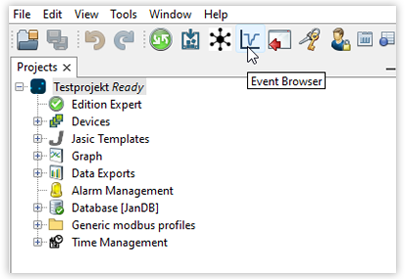
Fig. 1: Calling Event Browser in GridVis Desktop
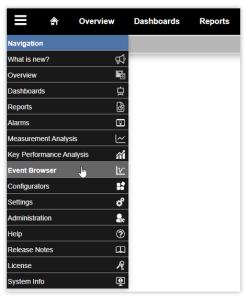
Fig. 2: Calling Event Browser in GridVis Web
Event and transients list
The key element of the Event Browser is a list of all the events and transients available for the corresponding parameters. Which transients and events are displayed here depends on the following parameters:
Selected devices
Period of time
Activated filters
|
Button |
Description |
|
|
Adjust the devices that are taken into account. |
|
|
Temporarily filter the list by device name. |
|
|
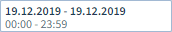
Adjust the period of time. |
|
|
Combinable filter selection for:
|
|
|
Submenu view with the actions:
|