Adjusting Event and Transient List
This page provides an overview of the adjustment options of the Event Browser of GridVis.
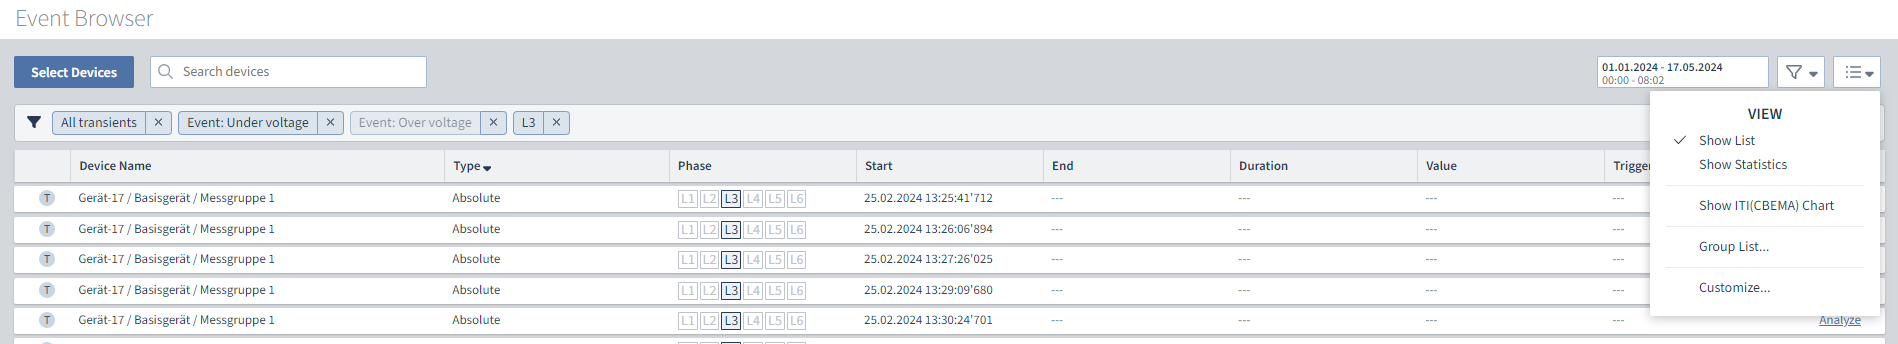
The View menu can be accessed via the View button in the upper area of the Event Browser.
|
View menu |
Description |
|
Display menu |
Displays the event and transient list (selectable only when the CBEMA chart is displayed) |
|
Display statistics (only available in List view) |
Information on:
|
|
Displays a CBEMA chart for all integrated devices. (selectable only when the list is displayed) |
|
|
Groups the list by predefined criteria such as date, device name, event/transient type or simultaneous events. |
|
|
Adjust |
Here, you adjust the color representation of the event duration. |
Group list
Various criteria are available to group the event/transient list via the Group list function in the View menu:
None
Date: The elements are grouped into predefined time periods by their start date. (for example: today, yesterday, this week, last week, etc.)
Device names
Event type (also includes transient types)
Simultaneous transients and events: groups events between which there is less time than the specified time window.
CBEMA Chart
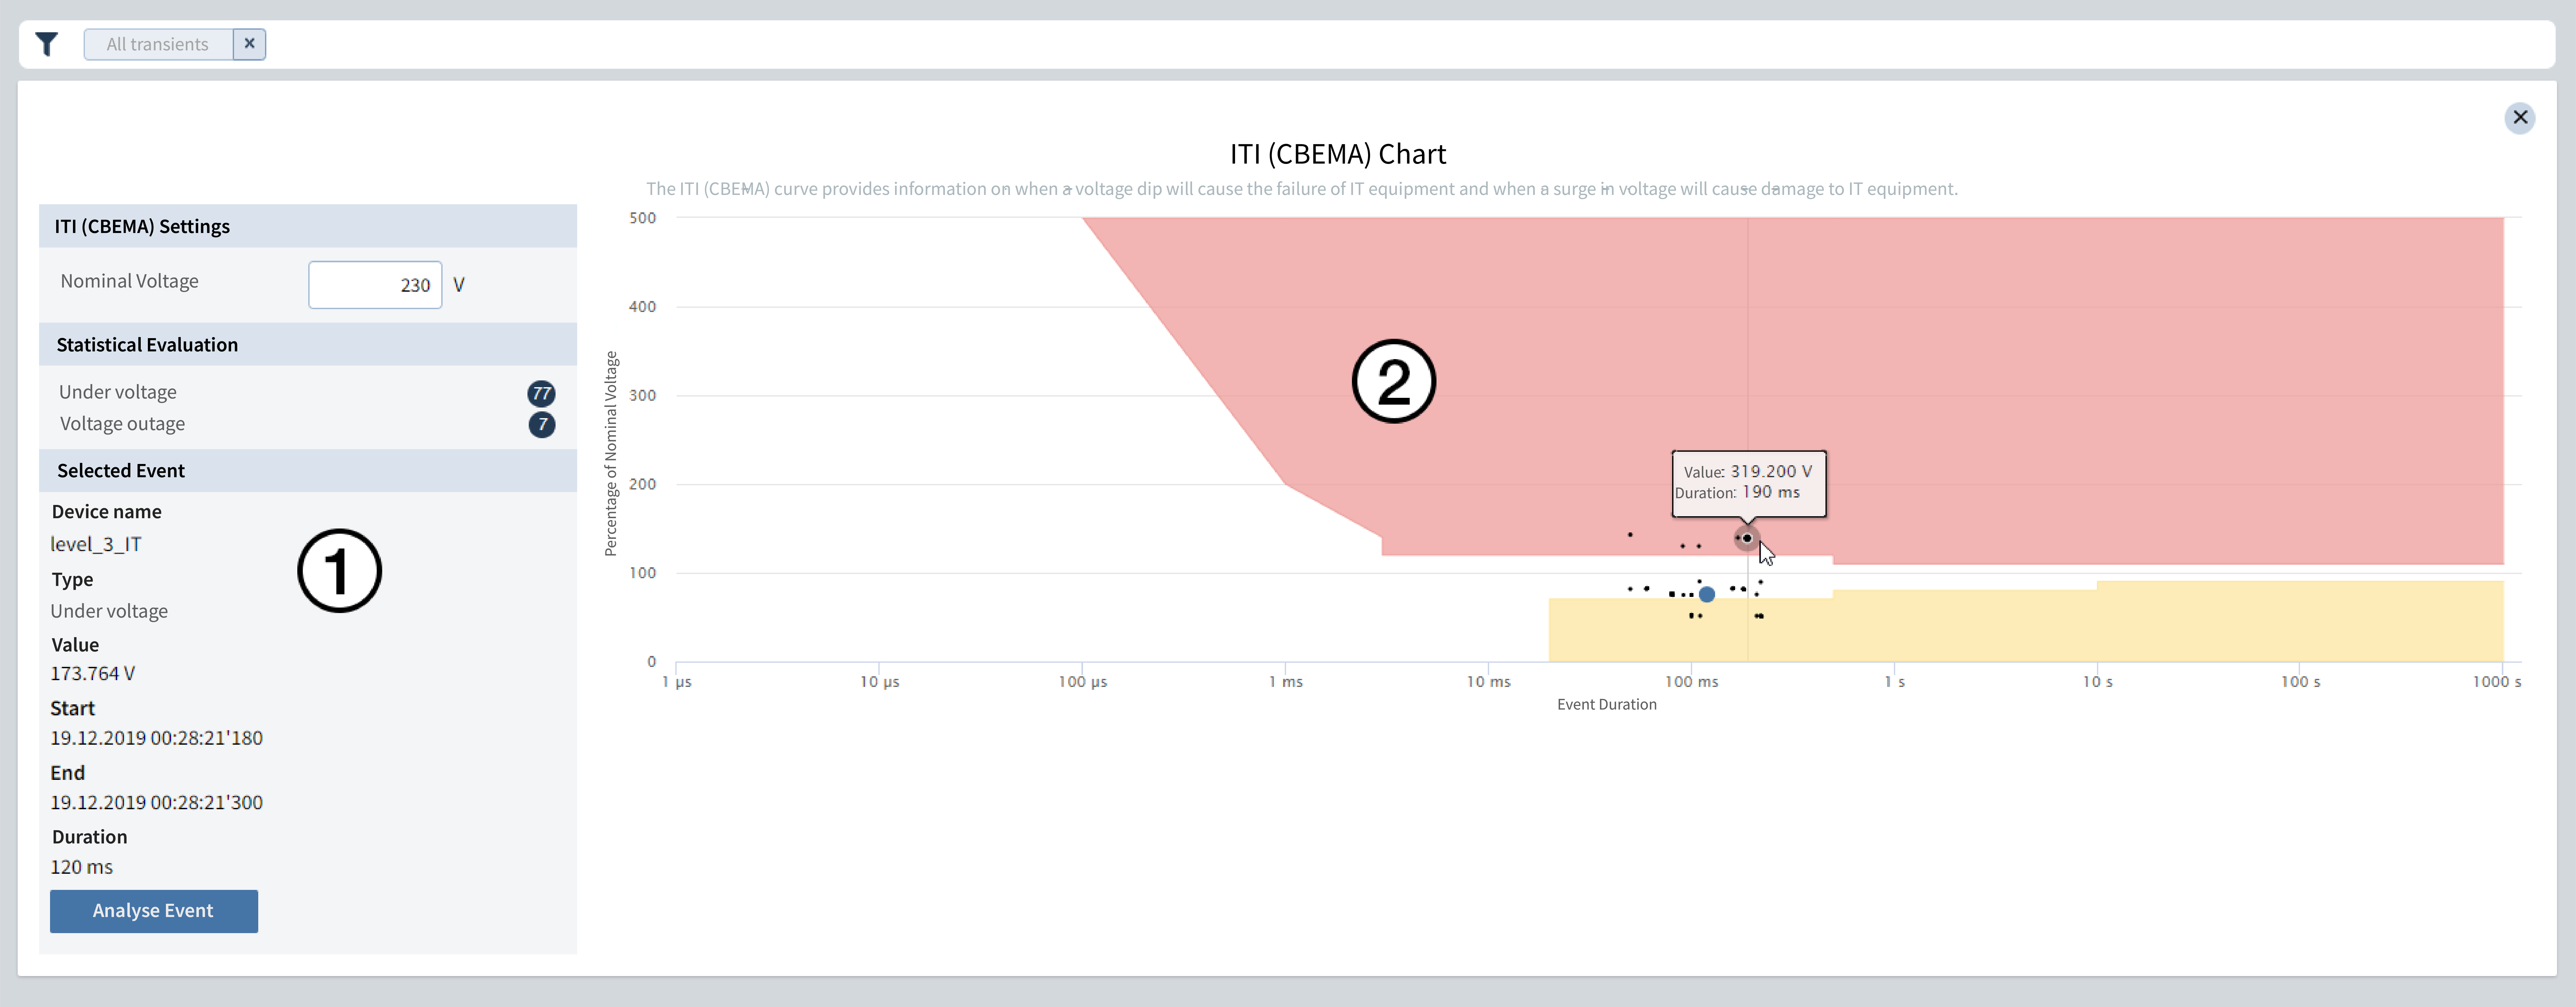
The ITIC curve or CBEMA curve (Computer Business Equipment Manufacturers Association) describes the maximum voltage deviation relative to the event duration that an electronic device must tolerate. The curve specifies permissible tolerances for the evaluation of events and thus enables possible faults to be interpreted.
You can use the option Display CBEMA curve in the View menu to open a CBEMA chart that displays the recorded voltage events of all integrated devices.
|
Position |
Description |
|
1 |
The overview contains an input field for the nominal voltage that serves as a reference for the CBEMA curve. |
|
2 |
In the CBEMA curve, each point represents a voltage event:
Hover over a point in the chart to see the value and duration of the event. Click on a point in the chart to retrieve more information about an event. |
Note
You use the device-specific History to call up a CBEMA chart that only includes events from the selected device.