Practical example of an energy recording report
Energy recording report using the example of a thermal bath
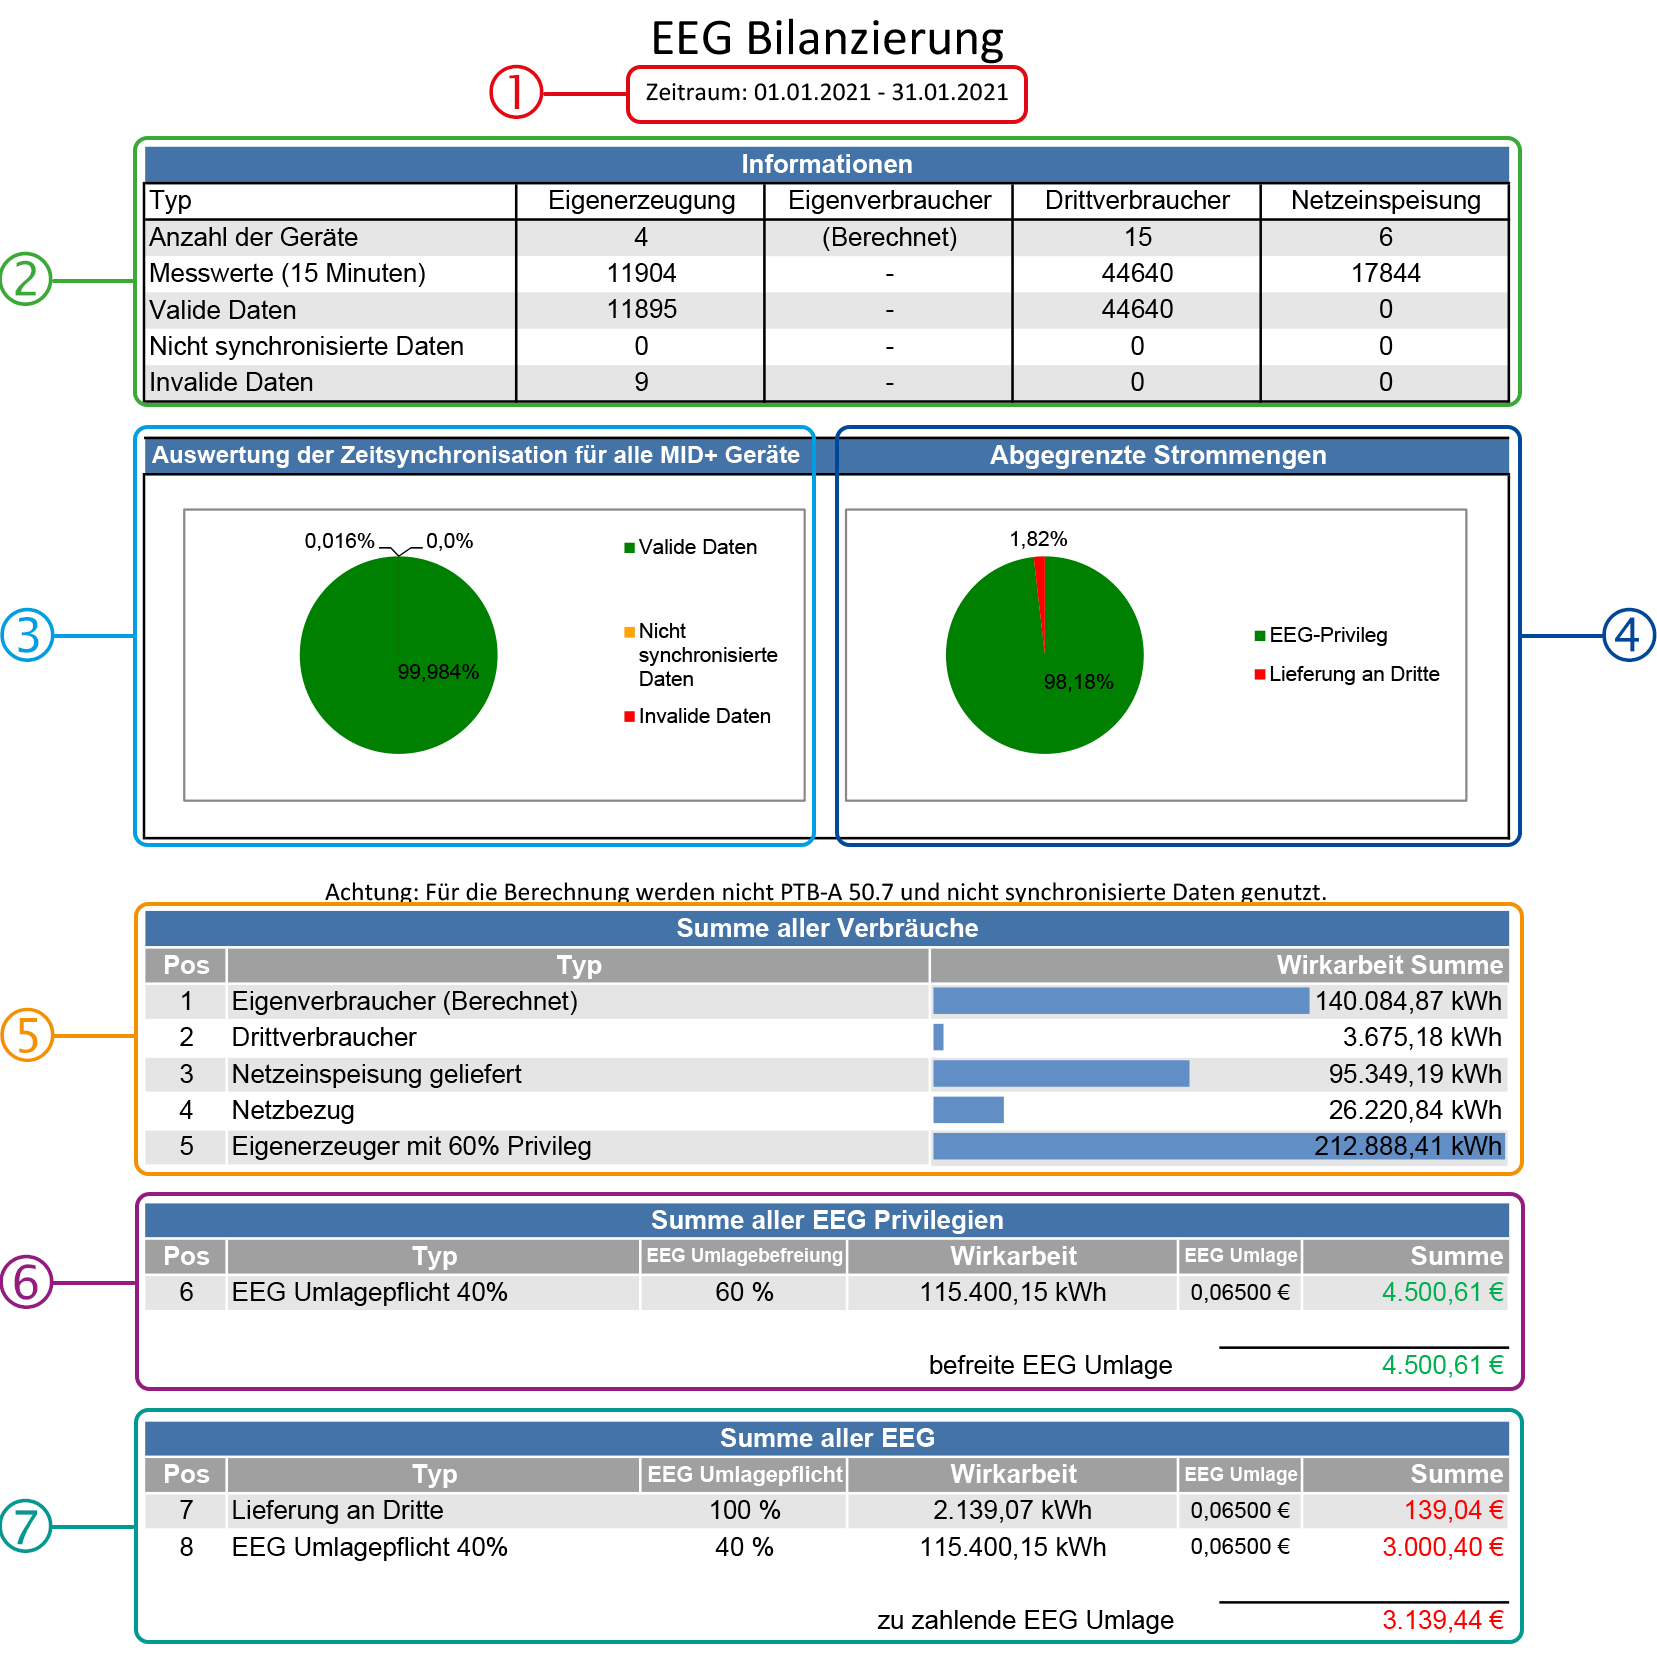
Evaluation of the measurement data over the report period:
|
Position |
Description |
|
1 |
Report period Specifies the time period covered by the report. The energy recording report usually looks at the past year. |
|
2 |
Information on the measured values Gives an overview of all recorded measurement points, the application and the status of the individual measured values (status information is only available for MID+ devices). |
|
3 |
Pie chart status of measured values Percentage listing of the status of all quarter-hourly measured values:
Only valid data sets are taken into account in the accounting process. Status information is only available for MID+ devices. |
|
4 |
Pie chart delimited electricity quantities Percentage breakdown of the delimited electricity quantities with EEG privilege and electricity quantities supplied to third parties. |
|
5 |
Sum of all consumptions List of all relevant consumptions over the report period |
|
6 |
Sum of all EEG privileges Total savings from EEG privileges |
|
7 |
Sum of all EEG Sum of the EEG apportionment to be paid |
|
8 |
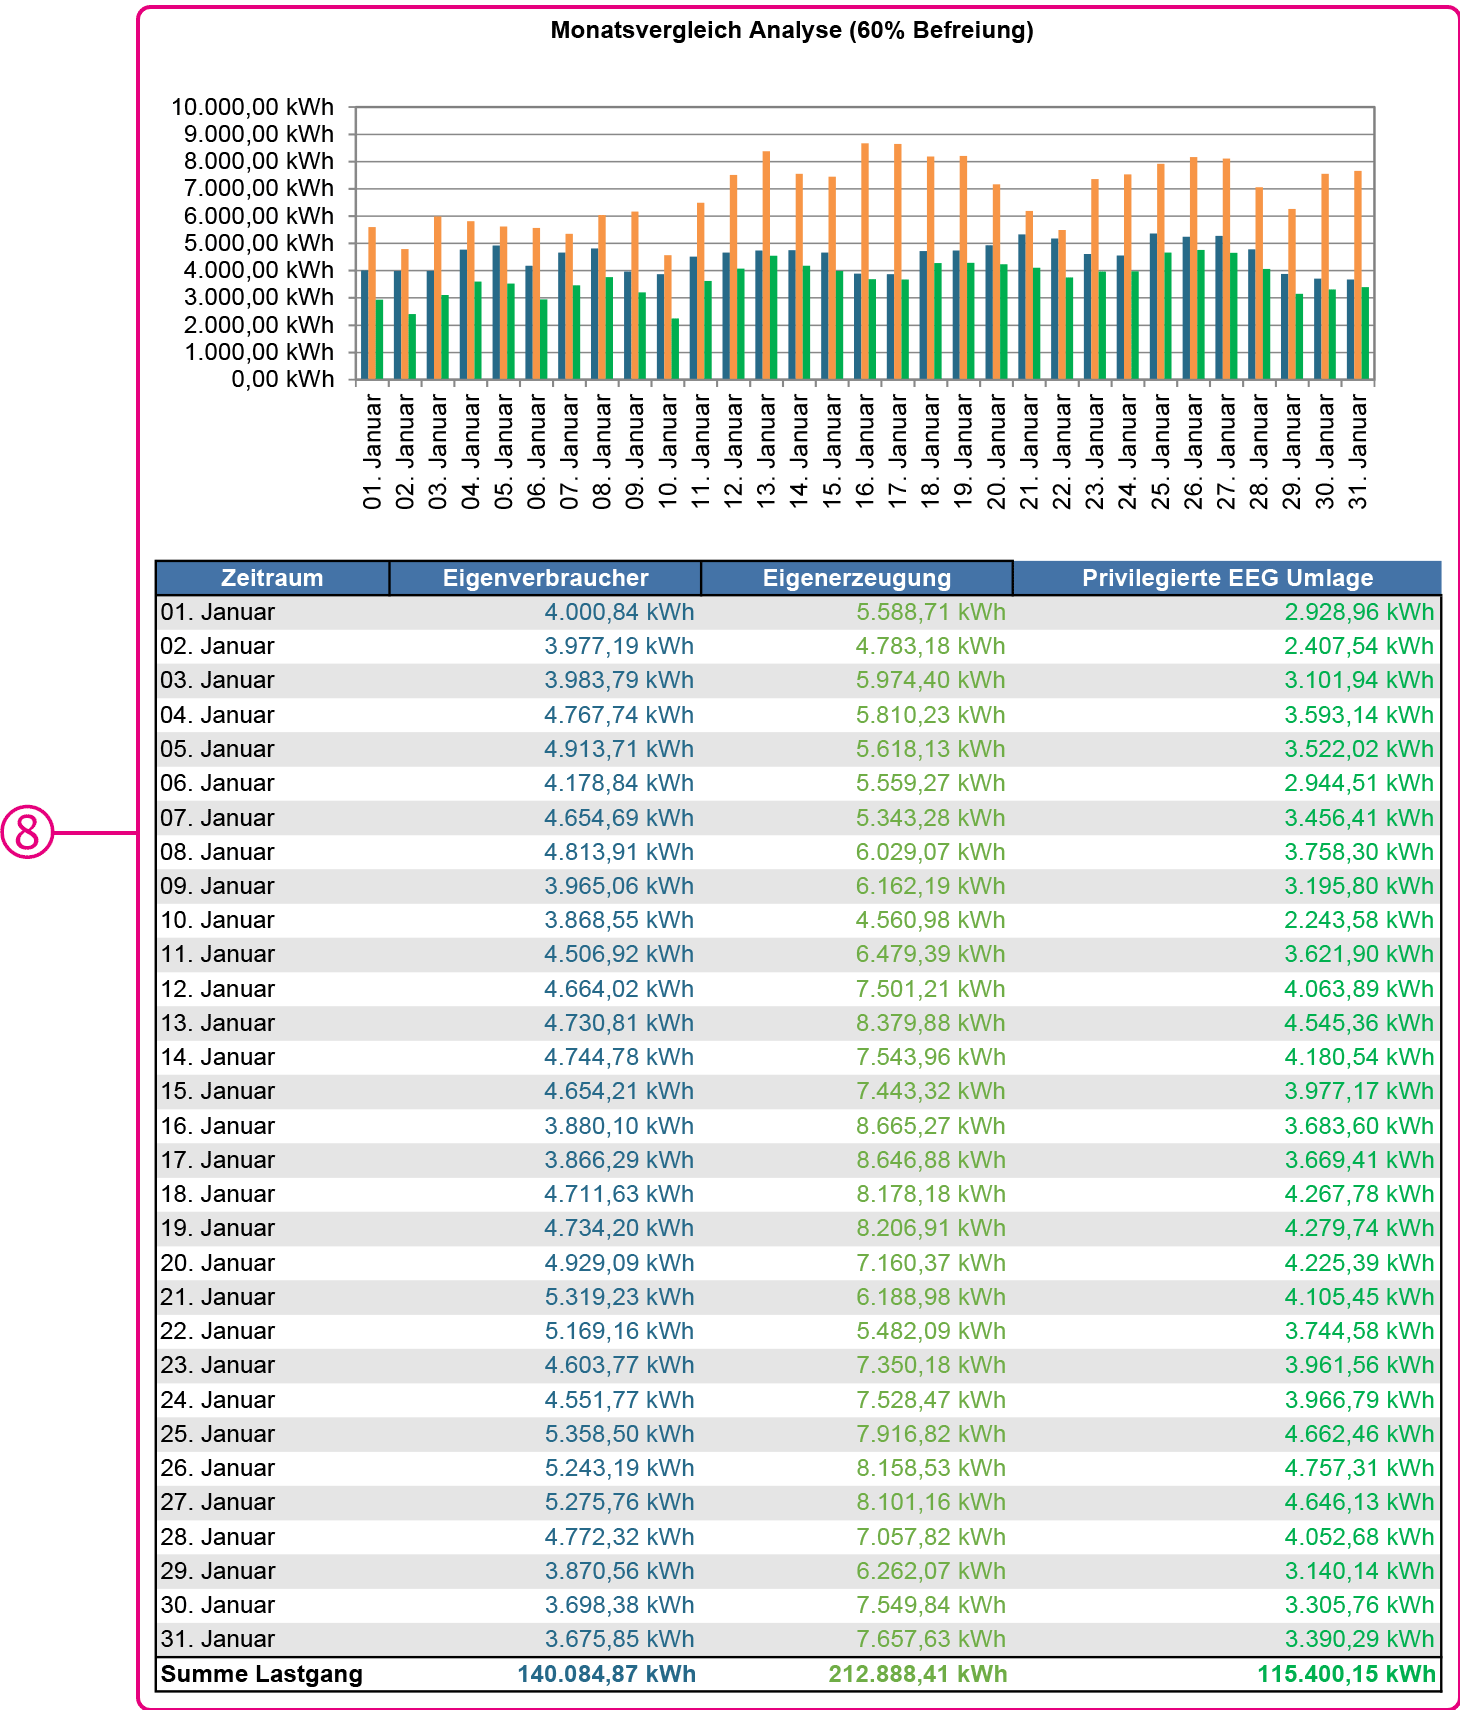
Comparative analysis Graphical and tabular overview of the relevant electricity quantities. |
Detailed lists of all measured values:
All measured values of all measuring points are listed on several worksheets of the energy recording report. In this way, each individual quarter-hourly measured value can be viewed and verified.
There is a separate worksheet for each of the following applications:
Self-generation
Self-consumer
Grid feed delivered
Grid feed consumed
Third-party consumer
Voluntary subordination rule
Which worksheets are actually included in the energy recording report depends on whether you delimit according to own consumption or third-party consumption.
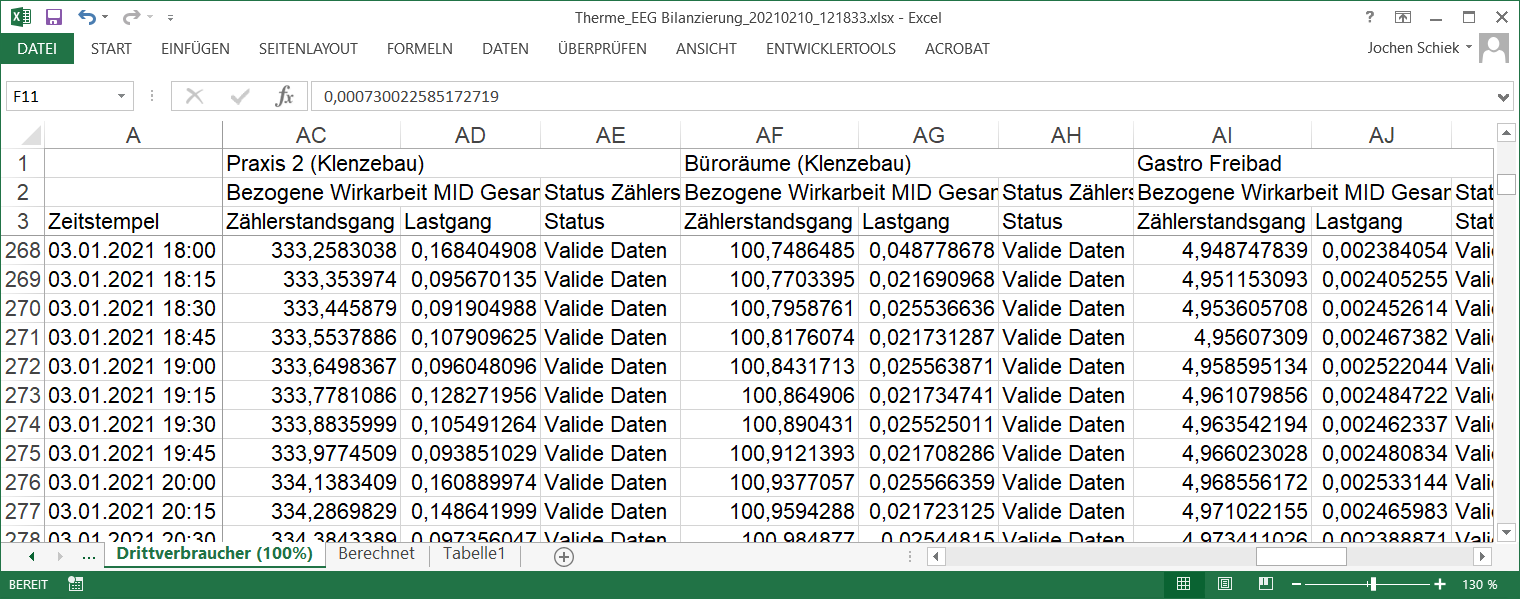
Example illustration of a worksheet for third-party consumers:
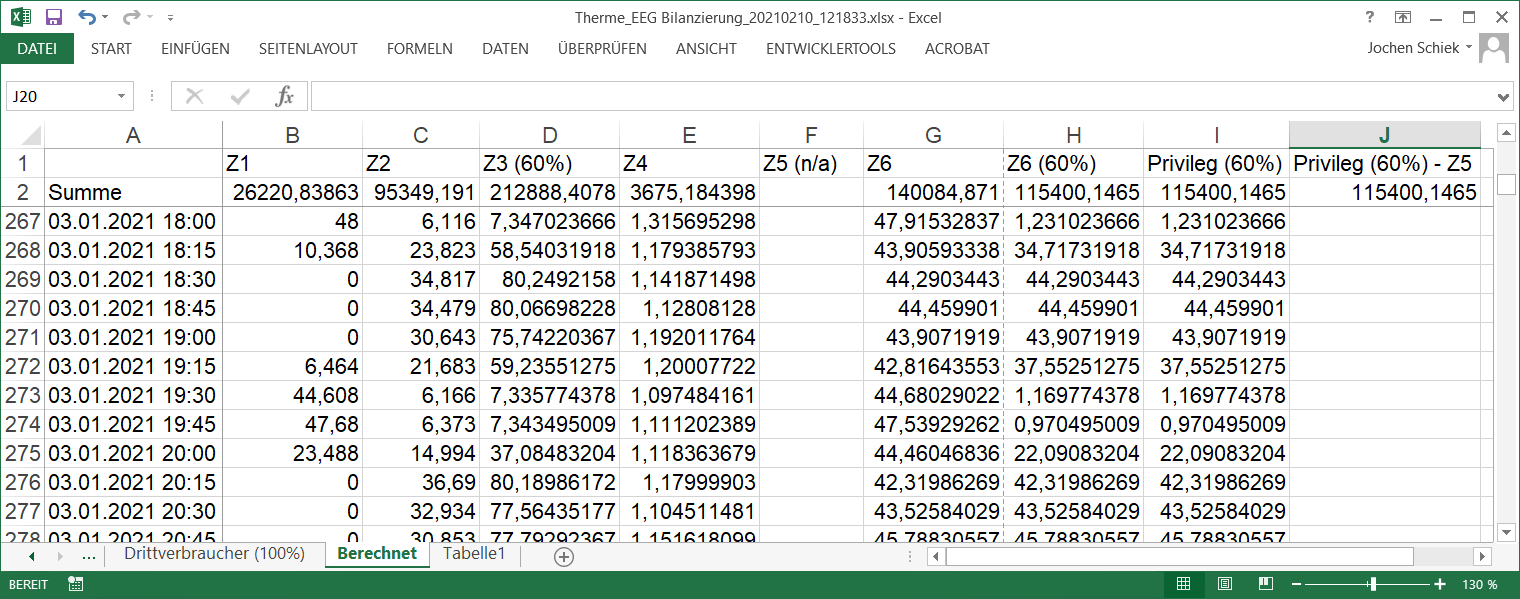
The "Calculated" worksheet contains the summary and the calculation of the report: