Graphic Objects
Image
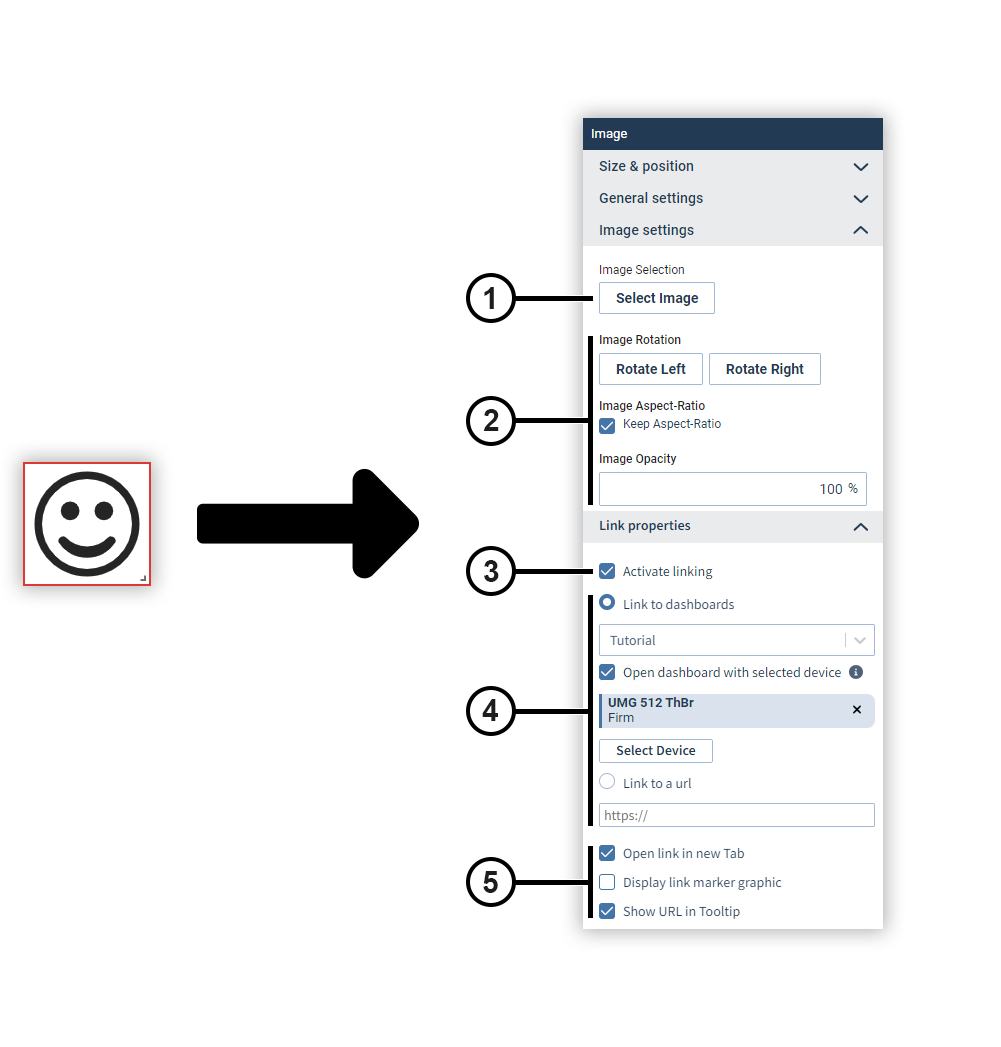
Use the Image object to place images on report pages or dashboards. To be able to use images in the image object, you must store them in the picture management (see Picture Manager ).
|
Position |
Description |
|
1 |
Opens the image selection window. |
|
2 |
Defines how the image is displayed. . |
|
3 |
Activates linking (for dashboards only). |
|
4 |
Defines the destination of the link (for dashboards only). |
|
5 |
Defines the behavior of the link (for dashboards only). |
Circle
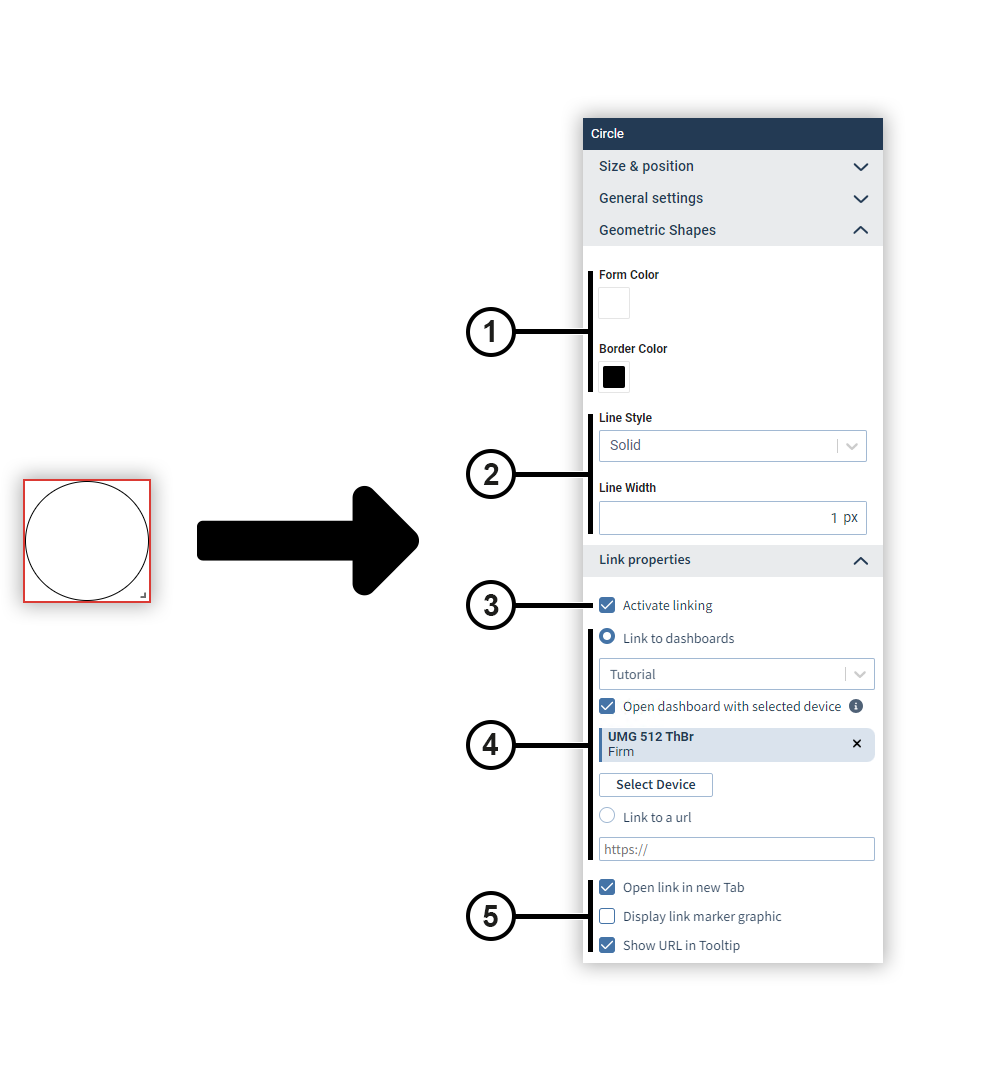
Use the Circle object to place circles or ellipses on report pages or dashboards. You can use it to highlight areas, for example.
|
Position |
Description |
|
1 |
Sets the background and border colors. |
|
2 |
Sets the line style and width. |
|
3 |
Activates linking (for dashboards only). |
|
4 |
Defines the destination of the link (for dashboards only). |
|
5 |
Defines the behavior of the link (for dashboards only). |
Borders & Lines
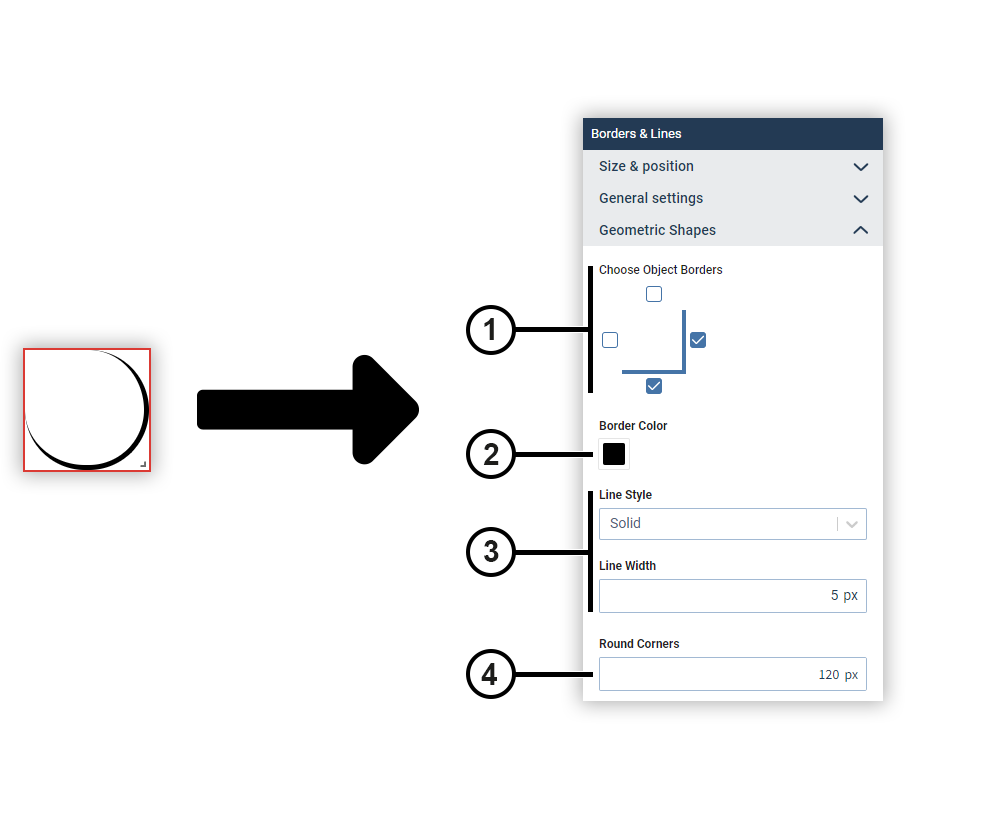
Use the Borders & Lines object to place various design elements on report pages or dashboards. You can flexibly adjust the border to create lines or round shapes, for example.
|
Position |
Description |
|
1 |
Specifies which sides of the border are displayed. |
|
2 |
Sets the border color. |
|
3 |
Sets the line style and width. |
|
4 |
Sets the rounding of the corners. |
Rectangle
Use the Rectangle object to place squares or rectangles on report pages or dashboards. You can use it to highlight areas, for example.

|
Position |
Description |
|
1 |
Sets the background and border colors. |
|
2 |
Sets the line style and width. |
|
3 |
Activates linking (for dashboards only). |
|
4 |
Defines the destination of the link (for dashboards only). |
|
5 |
Defines the behavior of the link (for dashboards only). |