Dashboards and Templates (up to GridVis version 9.0.0)
Function Dashboards (Dashboard Editor)
Widgets (Visualizations)
Function Templates (Template Editor)
General Description
Note
Before starting to create a dashboard or template, consider its use!
If one and the same layout should be reused to visualize different measuring devices (and measurement values), use the function Templates.
For a one-time visualization of energy and measurement data from different measuring devices, use the function Dashboards.
Dashboards can be assigned to users and personalized. Energy data such as consumed energy, load profiles and other measurement data can be transparently and helpfully visualized and evaluated generally. There are various widgets (graphical components for functions) available for configuring the dashboard.
Templates are for the reuse of saved dashboards. templates shorten the configuration time for your energy and measurement data visualizations. The configuration of the dashboards for multiple measuring devices is made more efficient through the use of templates and the web visualizations appear "of one piece" (the same layouts).
How do I open the function Dashboards and Templates in the GridVis Web?
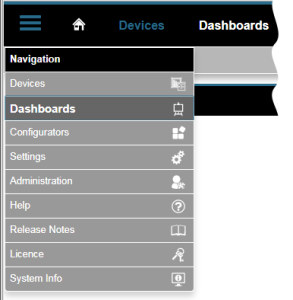
In the menu bar, click on the button Dashboards.
In the menu bar, click on the button Navigation and in the drop-down menu, click on the menu entry Dashboards.
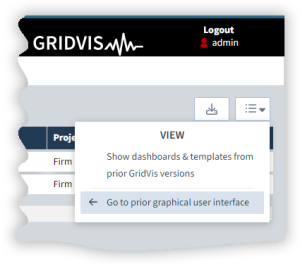
The Dashboard Manager opens.
Click on the View menu.
Click on the Go to prior graphical user interface button.
Note
The function Dashboards contains the editors for the Dashboards and the Templates:
Glossary
|
Dashboard |
Individually designed website (web visualization / graphical interface) for displaying your energy and measurement data. |
|
Template |
For the reuse of a saved dashboard. |
|
Widgets |
Graphical components for functions that are positioned and configured on the dashboard. |