Function Dashboards (Dashboard Editor)
General Description
You can create, configure and edit the dashboards (websites) in the function Dashboards (Dashboard Overview).
Dashboards are websites for the visualization of energy and measurement data.
Dashboard layouts can be individually designed.
Note
Before starting to create a dashboard, consider its use. If your dashboard should be reused for several devices of your project, create it using the function Templates. Templates are for the reuse of saved dashboards.
How do I open the function Dashboards in the GridVis Web?
In the menu bar, click on the button Dashboards.
In the menu bar, click on the button Navigation and in the drop-down menu, click on the menu entry Dashboards.
The Dashboard Manager opens.
Click on the View menu.
Click on the Go to prior graphical user interface button.
To get to the dashboard overview, click on the button Dashboards in the subnavigation.
Overview Window of the Function Dashboards
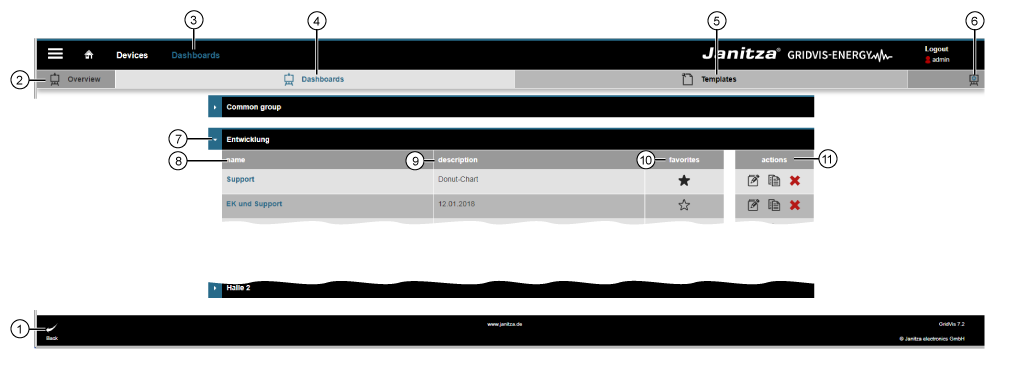
Menu Navigation -> Dashboards > Dashboards button in the subnavigation
|
Position |
Description |
|
1 |
|
|
2 |
|
|
3 |
|
|
4 |
|
|
5 |
|
|
6 |
|
|
7 |
|
|
8 |
|
|
9 |
|
|
10 |
|
|
11 |
|
|
|
|
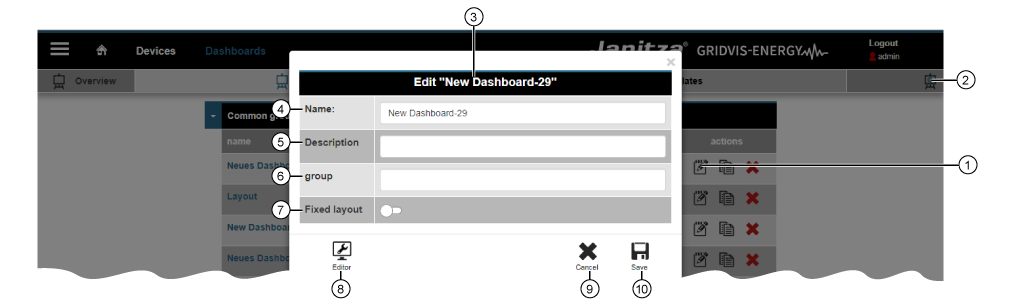
Assistant Edit Dashboard
Click on the button Edit (in the column Actions of the overview window) or the button Add Dashboard an assistant appears to configure the dashboard.
|
Position |
Description |
|
1 |
|
|
2 |
|
|
3 |
|
|
4 |
|
|
5 |
|
|
6 |
|
|
7 |
Slider off:
Slider on: Select the monitor format for the following media:
|
|
8 |
Note
|
|
9 |
|
|
10 |
|
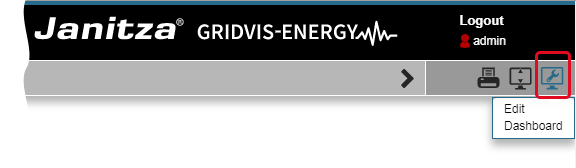
Dashboard editor
Opens the Dashboard Editor:
Click on the button Editor in the assistant Edit Dashboard
(The "Tool Tip" appears when you hover with the mouse over the button).Double-click on the dashboard Name in the dashboard overview window.
- The Dashboard will appear.
- In the Dashboard click on the button Edit Dashboard (cf. image on the right).
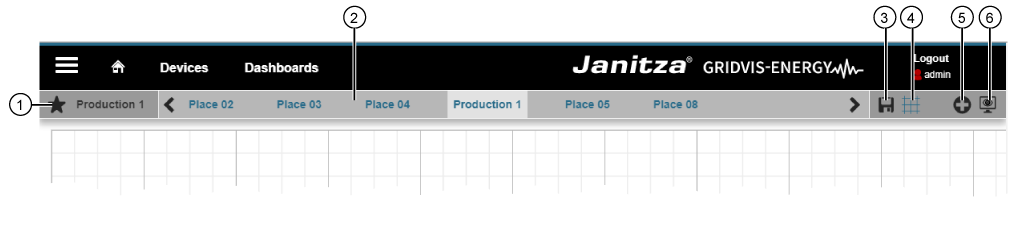
Description Dashboard Editor
|
Position |
Description |
|
1 |
|
|
2 |
|
|
3 |
|
|
4 |
|
|
5 |
|
|
6 |
|