Widgets (Visualizations)
General Description
Widgets are graphical components for functions that are positioned and configured on the dashboard. With the help of widgets you can quickly and simply create easy-to-read dashboards (websites) with images of your energy and measurement data.
The GridVis Energy provides a variety of widgets for you to create your dashboard (see
Widgets Overview
). Widgets can be placed and configured simply and intuitively on your dashboard.
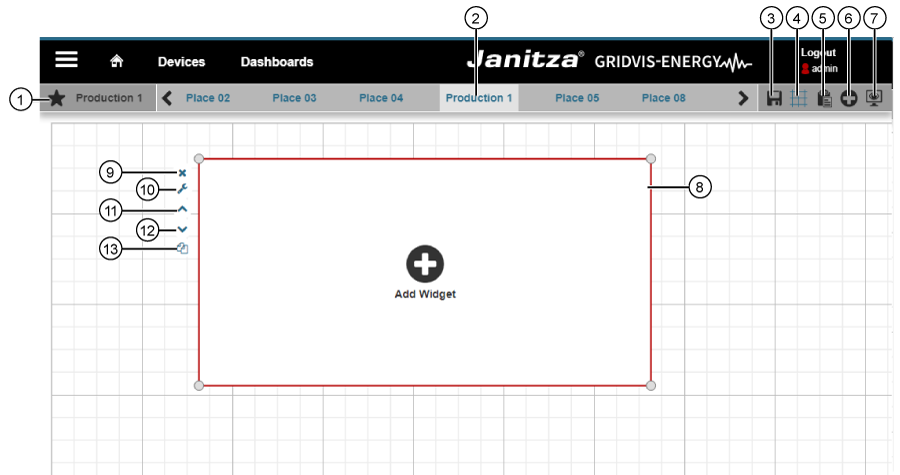
Add Widget
|
Position |
Description |
|
1 |
|
|
2 |
|
|
3 |
|
|
4 |
|
|
5 |
|
|
6 |
|
|
7 |
|
|
8 |
|
|
9 |
|
|
10 |
|
|
11 |
|
|
12 |
|
|
13 |
|
Assistant Edit Widget and Widgets Overview
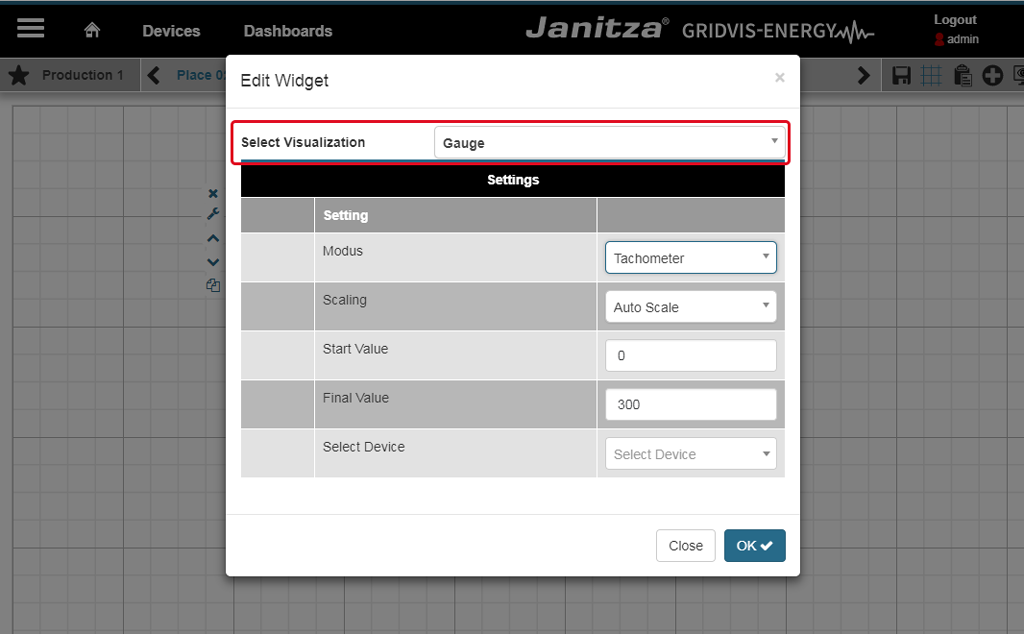
Clicking on the icon Edit Visualization (  ) will open the assistant Edit Widgets. In the option list Select Visualization, select your widget. The following widgets are available:
Display Instrument
Bar Chart (Multi)
Bar Chart (Single)
Image
Donut Chart
Energy Overview (Multi)
Energy Overview (Single)
Heat Map
Indicator (Live)
Key Performance Indicator (KPI)
Cost Report (Multi)
Cost Overview
Pie Chart
Line Chart (Live)
Line Chart (Historical)
Measurement Values (Live)
Min/Max Overview
Sankey Diagram
Text Editor
Weather