Measurement Analysis
Valid for
|
GridVis editions |
Software platform |
|
|
|

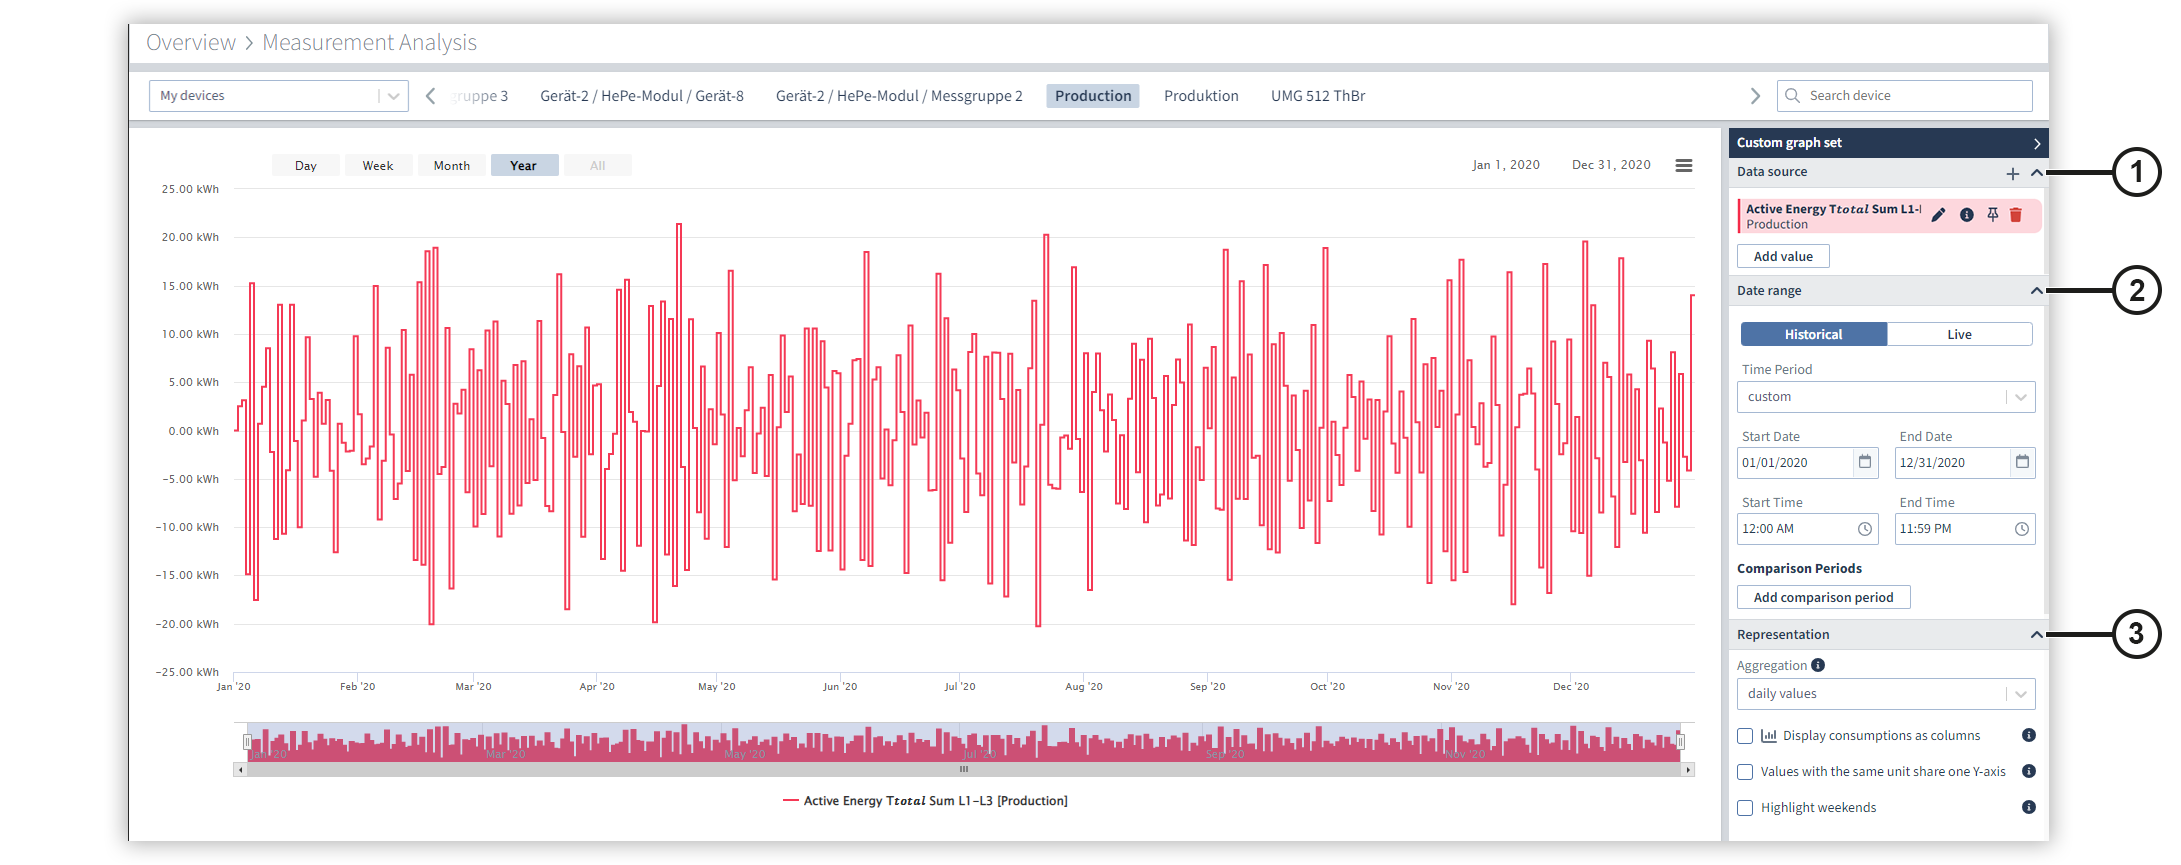
Use the measured value analysis to display measured values from selected devices.
Move the mouse over a device in the
Device overview
, click on the three-dot menu and then on the graph icon (![]() ) to open the measured value analysis function.
) to open the measured value analysis function.
|
Position |
Description |
|
1 |
Displays the selected measured value with the associated measurement device.
|
|
2 |
Specify the settings for the start and end time, as well as for the comparison periods. You can add up to two comparison periods. |
|
3 |
Specify the settings for the display and aggregation of the measured values here. Hinweis Please note that the measured values can only be displayed as columns if all measured values have the same aggregation period. Note that the weekends can only be highlighted if all measured values use an aggregation period of one week or less. |