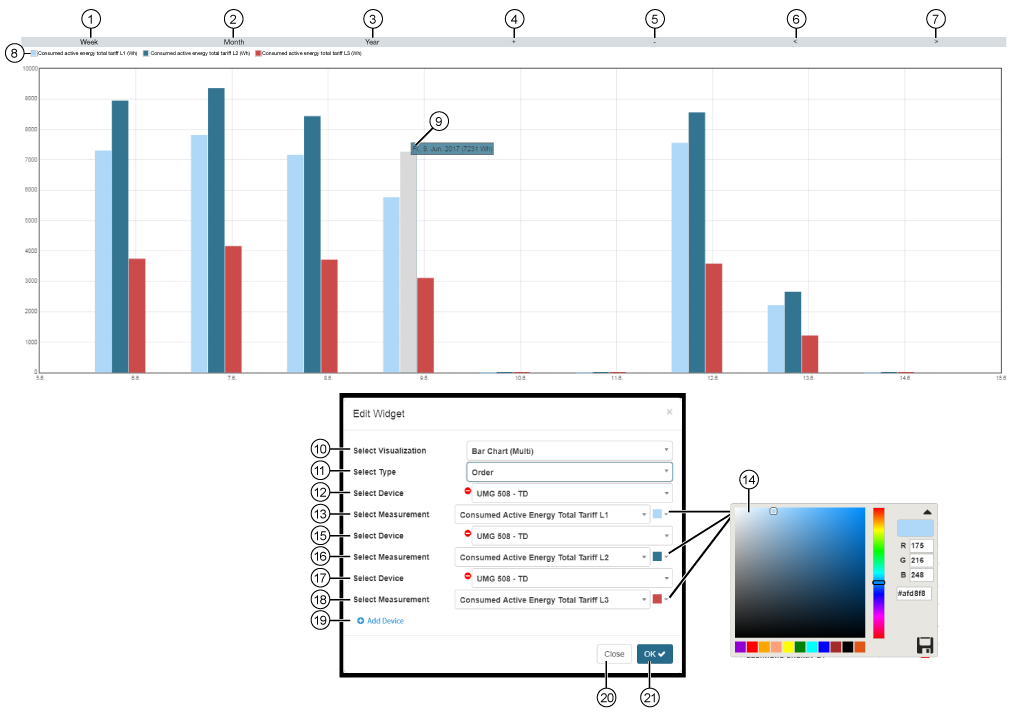
Bar Chart (Multi)


images/download/attachments/251037623/W_Balkendiagramm_multi_EN-version-1-modificationdate-1519823380000-api-v2.png

Position

Description

1

  • Shows the values of your quantities in the days of one week.

2

  • Shows the values of your quantities in the days of one month.

3

  • Shows the values of your quantities in the months of one year.

4

  • Zoom into the graphed timeframe.

5

  • Zoom out of the graphed timeframe.

6

  • Previous (<)timeframe (depending on the timeframe setting - Pos. 1, 2, 3).

7

  • Next (>)timeframe (depending on the timeframe setting - Pos. 1, 2, 3).

8

  • Colors used for showing the quantities in the bar chart.

9

  • Hold the mouse cursor over a bar in the chart (the bar turns gray).

  • Shows the Timepoint and Measurement Value of the quantity in the set color (Pos. 14).

10

  • Selection of the Widgets (visualization).

  • Bar Chart (Multi) selected.

11

Presentation options for the bar chart (multi):

  • Under each other - adds the quantities of the devices to one total bar.

  • Order - shows the bars of the quantities next to each other (see screen grab above).

12

  • Selection of the first device.

  • Contains all devices with storage (historical data) of your project.

13

  • Selection of a quantity, of the previously selected device.

14

Selection of the quantity color in the bar chart.

  • RGB and Hex entry.

  • Color spectrum slider.

  • Color suggested is the last selected color.

  • Save your color configuration in the color picker by clicking on the save symbol (

    images/download/thumbnails/251037623/speichern-version-1-modificationdate-1517404127000-api-v2.png

    ).

15

  • Selection of the second device.

  • Contains all devices with storage (historical data) of your project.

16

  • Selection of a quantity, of the previously selected device.

17

  • Selection of the third device.

  • Contains all devices with storage (historical data) of your project.

18

  • Selection of a quantity, of the previously selected device.

19

  • Creates a new device (with quantity selection) to display in the bar chart.

  • Configuration of up to 5 devices (with their respective quantity selection).

20

  • Closes the assistant Edit Widgets without saving the entries.

21

  • Saves your configuration.

  • The Widget appears on the Dashboard.