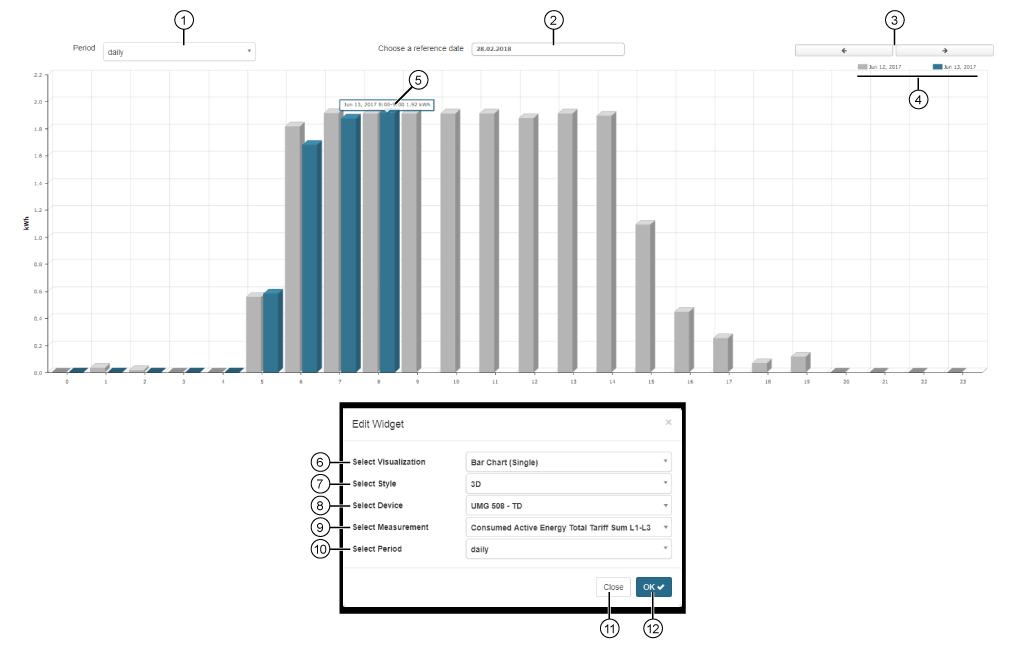
Bar Chart (Single)


images/download/attachments/251037627/W_Balkendiagramm_single_EN-version-1-modificationdate-1519823939000-api-v2.png

Position

Description

1

Selection of the timeframe presented in the bar chart (Single):

  • daily

  • weekly

  • monthly

  • annually

2

  • Selection of a reference date.

  • For the selected date, shows the reference quantity (blue bar).

3

  • Previous (<)timeframe.

  • Next (>)timeframe.

  • Depending on the setting Select Timeframe (Pos. 1).

4

Color field (gray or blue) with the timeframe for the displayed quantities (bars).
Depending on the setting Select Timeframe (Pos. 1), the following displays appear:

  • daily: Date.

  • weekly: Week number.

  • monthly: Month and year.

  • annually: Year.

Hold the mouse cursor over a color field to hide the bars of the other color.

5

Hold the mouse cursor over a bar in the chart.
Depending on the setting Select Timeframe (Pos. 1) the following displays appear:

  • daily: Day, time, measurement value.

  • weekly: Day of the week, measurement value.

  • monthly: Day of the month, measurement value.

  • annually: Month, measurement value.

6

  • Selection of the Widgets (visualization).

  • Bar Chart (Single) selected.

7

Presentation options for the bar chart (single):

  • 3D bar display.

  • Normal bar display.

8

  • Select device.

  • Contains all devices with storage (historical data) of your project.

9

  • Selection of a quantity, of the previously selected device.

10

Selection of the timeframe presented in the bar chart (Single):

  • daily

  • weekly

  • monthly

  • annually

11

Closes the assistant Edit Widgets without saving the entries.

12

  • Saves your configuration.

  • The Widget appears on the Dashboard.