Donut Chart


images/download/attachments/251037633/Donut_Chart-version-1-modificationdate-1517404195000-api-v2.png

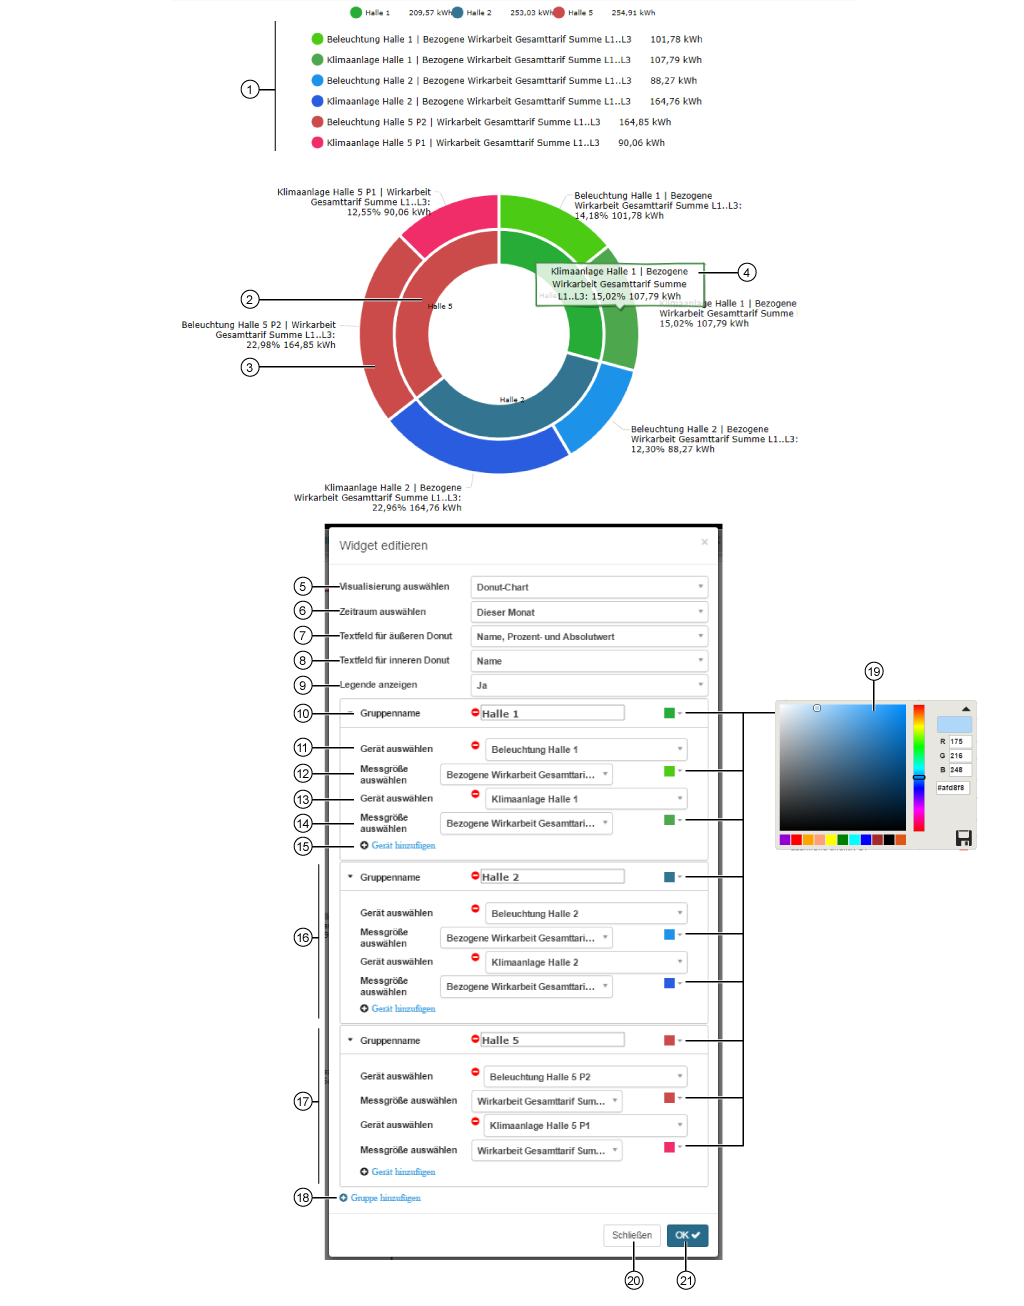
The donut chart (ring chart) shows

  • quantities as absolute values or as percentages of a whole, while simultaneously displaying two data series (inner + outer donut).

  • quantities or groups of quantities as individual segments.

Position

Description

1

  • Colors used for showing the measuring devices, quantities and measurement values in the donut chart.

2

  • Presentation and descriptions of the measuring device groups (cf. Pos. 8).

3

  • Presentation and descriptions of the measuring devices and quantities (cf. Pos. 7).

4

Hold the mouse cursor over an outer donut segment to see a description (individual measuring devices). Display:

  • Measuring device - Name/Designation of the measuring device.

  • Quantity -Selected quantity.

  • Measurement value - As percentage and absolute value.

Inner donut segments (measuring device groups) have no description displays.

5

  • Selection of the Widgets (visualization).

  • Donut Chart selected.

6

Selection of the timeframe presented:

  • This month

  • Last month

  • This year

  • Last year

  • Overview of the last 30 days

7

Shows, depending on the option selected, labels (descriptions) for individual measuring devices in the outer donut segments:

  • Name - Name/Designation and quantity of the measuring device.

  • Percent - Percentage of the measurement value of the whole.

  • Absolute - Absolute value of the measurement value.

  • Name and Percent - Name/Designation of the measuring device, quantity and percentage of the measurement value of the whole.

  • Name, Percent and Absolute Value - Name/Designation of the measuring device, quantity, percentage and absolute value of the measurement value (see screen grab above).

  • No label.

8

Shows, depending on the option selected, labels (descriptions) for the measuring device groups in the inner donut segments:

  • Name - Group name (measuring device groups)

  • Percent - Percentage of the group measurement values of the whole.

  • Absolute - Absolute value of the group measurement value.

  • Name and Percent - Group name and percentage of the group measurement values of the whole.

  • Name, Percent and Absolute Value - Group name, percentage and absolute values of the group measurement values.

  • No label.

9

Options:

  • Yes - The widget shows a legend (cf. Pos. 1).

  • No - The widget doesn't show a legend.

10

  • In the option field, assign a Group Name a name for the measuring device group (in the above screen grab "Hall 1").

  • Click on the triangle next to the Group Name to expand or hide the option field.

  • Color selection for the presentation of the measuring device group in the donut chart (cf. Pos. 19).

11

  • Selection of the first device (in the above screen grab "Lighting Hall 1") in the first measuring device group (Hall 1).

  • Includes all devices with memory (historical data) in your project.

12

  • Selection of the quantity, of the previously selected device.

  • Selection of color for the presentation of the quantity in the donut chart (cf. Pos. 19).

13

  • Selection of the second device (in the above screen grab "Air conditioning Hall 1") in the first measuring device group (Hall 1).

  • Includes all devices with memory (historical data) in your project.

14

  • Selection of the quantity, of the previously selected device.

  • Selection of color for the presentation of the quantity in the donut chart (cf. Pos. 19).

15

  • Creates a new device for your donut chart.

  • Configuration of up to X devices.

16

  • Select your group name, your measuring devices and their quantities, as described in Pos. 10 to 15.

17

  • Select your group name, your measuring devices and their quantities, as described in Pos. 10 to 15.

18

  • Creates a new group for your donut chart.

19

Selection of colors for the Measuring Device Groups and Quantities of the Individual Measuring Devices in the donut chart.

  • RGB and Hex entry.

  • Color spectrum slider.

  • Color suggested is the last selected color.

  • Save your color configuration in the color picker by clicking on the save symbol (

    images/download/thumbnails/251037633/speichern-version-1-modificationdate-1517404196000-api-v2.png

    ).

20

  • Closes the assistant Edit Widgets without saving the entries.

21

  • Saves your configuration.

  • The Widget appears on the Dashboard.