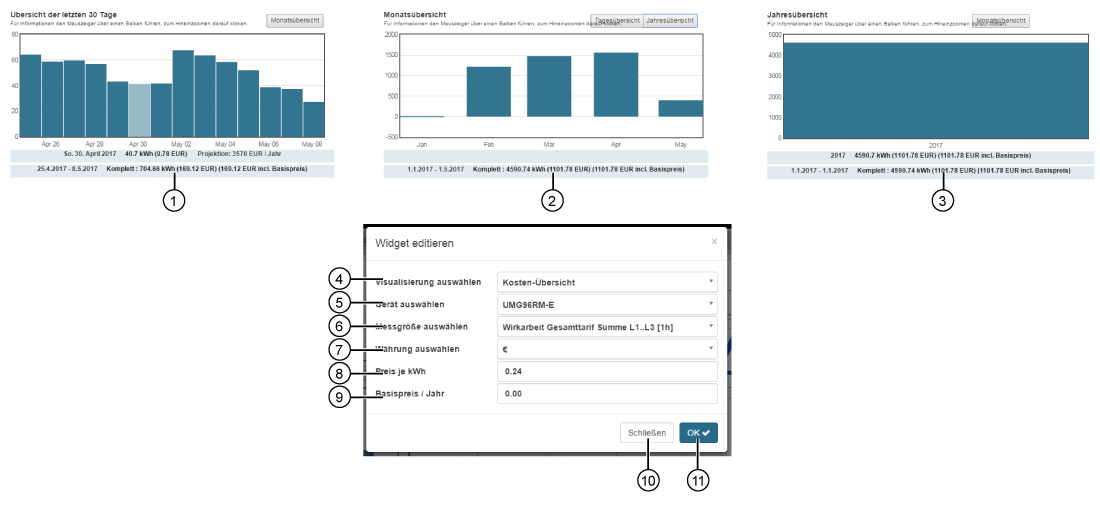
Cost Overview


images/download/attachments/251037655/kostenuebersicht-version-1-modificationdate-1517404366000-api-v2.png

Position

Description

1

  • Shows a bar chart Overview of the last 30 days (if there are data in the device memory).

  • Hold the mouse cursor over the bar for daily information.

  • The button leads to the Monthly Overview Pos.2

2

  • Shows a bar chart Monthly Overview (if there are data in the device memory).

  • Hold the mouse cursor over the bar for monthly information.

  • The buttons lead to Daily Overview (Pos.1) or to Annual Overview Pos.3

3

  • Shows a bar chart Annual Overview (if there are data in the device memory).

  • Hold the mouse cursor over the bar for annual information.

  • The button Monthly Overview Pos.2

4

  • Selection of the Widgets (visualization).

  • Cost Overview selected.

5

  • Select device.

  • Includes all devices with memory (historical data) in your project.

6

Selection of an energy quantity, of the previously selected device, such as

  • Total real power at full rate L1..L3 (1h)

  • Total drawn real power at full rate L1..L3 (1h)

  • Total delivered real power at full rate L1..L3 (1h)

  • Total inductive apparent power at full rate L1..L3 (1h)

7

  • Selection of Currency.

8

  • Entry of the valid energy price per kWh in your region.

9

  • Entry of the valid basic price/year.

10

  • Closes the assistant Edit Widgets without saving the entries.

11

  • Saves your configuration.

  • The Widget appears on the Dashboard.