Pie Chart
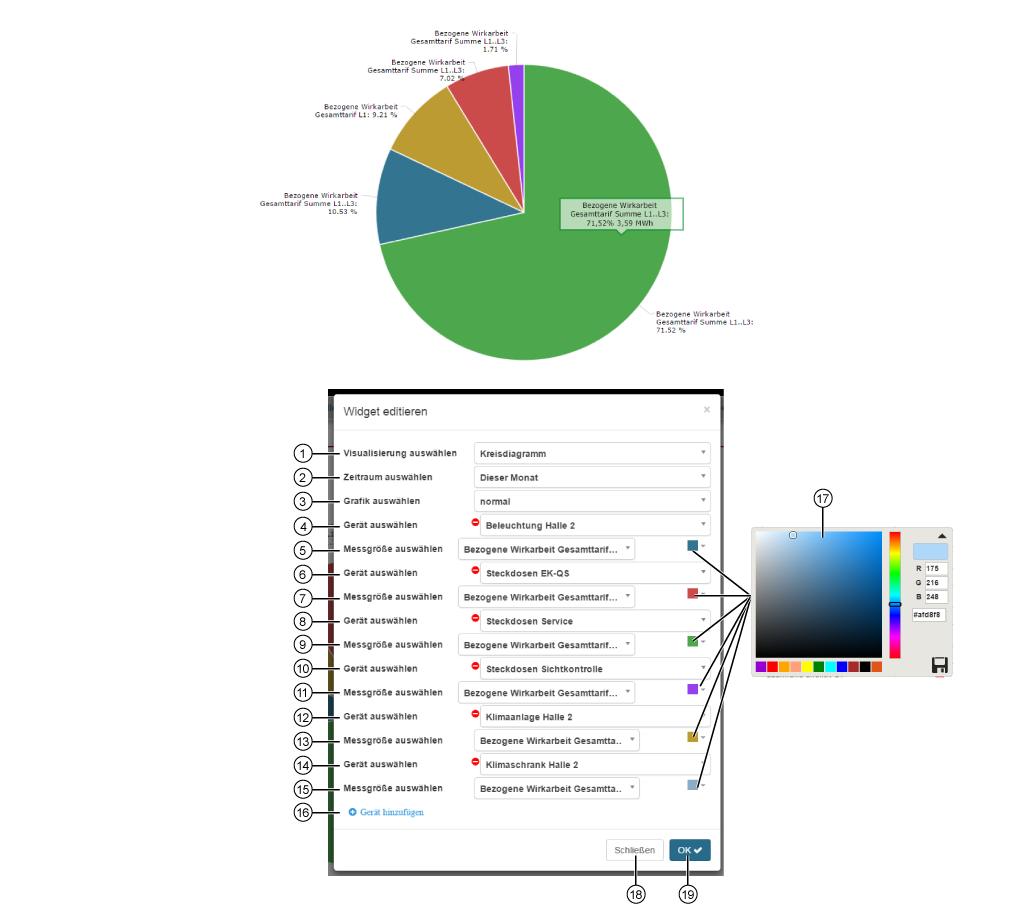
The pie chart shows:
quantities as a percentage of the whole.
A description with the details Quantity, percentage value and absolute value, if the mouse cursor is held over a sector of the circle.
|
Position |
Description |
|
1 |
|
|
2 |
Selection of the timeframe presented:
|
|
3 |
Selection of the view:
|
|
4 |
|
|
5 |
|
|
6 |
|
|
7 |
|
|
8 |
|
|
9 |
|
|
10 |
|
|
11 |
|
|
12 |
|
|
13 |
|
|
14 |
|
|
15 |
|
|
16 |
|
|
17 |
Selection of the quantity color in the pie chart.
|
|
18 |
|
|
19 |
|