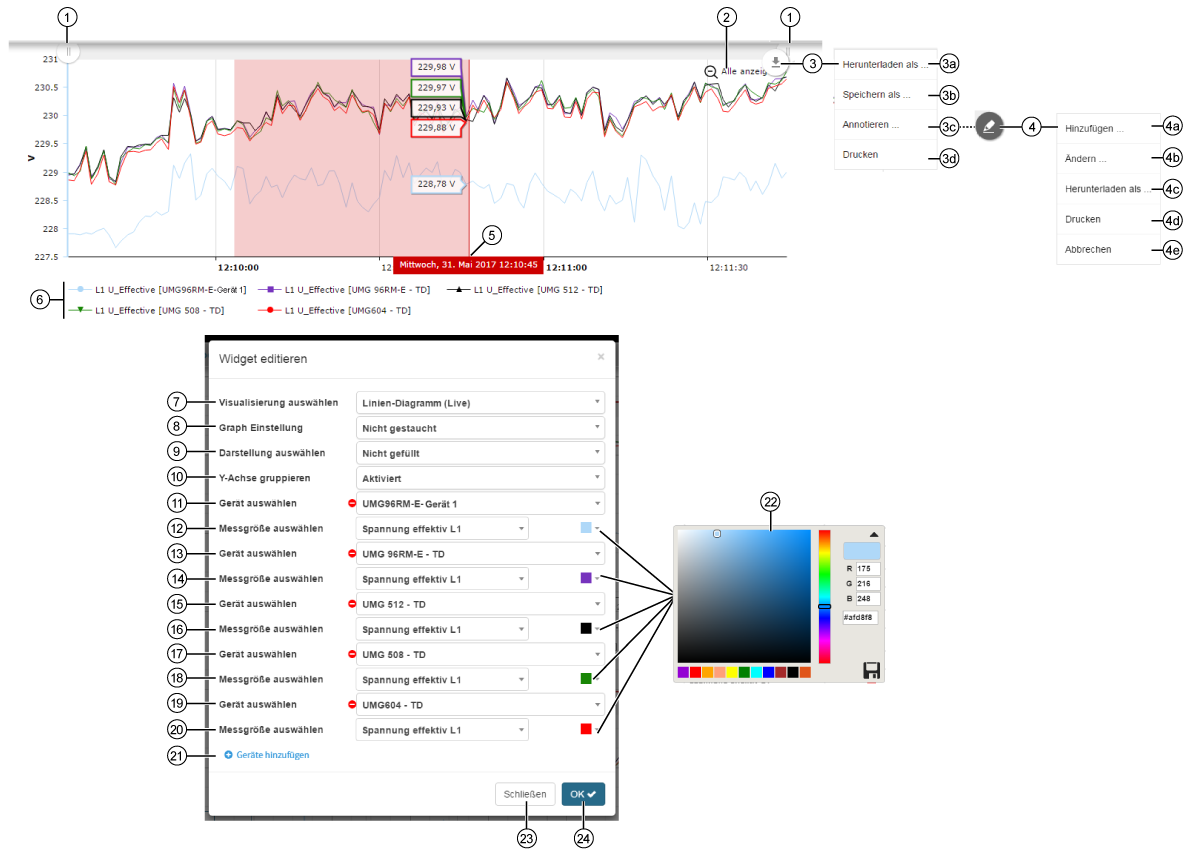
Line Chart (Live)


images/download/attachments/251037660/Liniendiagramm_live-version-1-modificationdate-1517404424000-api-v2.png

Position

Description

1

  • Time interval as a section of the time scale of the line chart (of live measurement values).

  • You can push the sliders to change the presentation of the line chart. You can zoom into the measurement value view.

2

  • Zoom out of the measurement value view.

  • Change the presentation - from time interval to the complete time scale of the measurement value view.

3

  • When you move the mouse over the mouseover element images/download/thumbnails/251037660/mousoverelement-version-1-modificationdate-1517404424000-api-v2.png a menu opens.

3a

  • PN G file - Graphics format for Grid graphics with lossless data compression .

  • JPG file - Compressed image data format.

  • SVG file - Scalable vector graphic (XML-based).

  • PDF file - Portable and platform-independent document format (open with a PDF reader).

3b

  • CSV file

  • XLSX file

  • JSON file

3c

Click on the menu entry Annotate

  • and the mouseover element images/download/thumbnails/251037660/mousover_annotieren-version-1-modificationdate-1517404424000-api-v2.png will appear (cf. Pos. 4).

  • The presented time interval (section) stops the line chart. The section can be annotated (cf. Pos. 4, 4a - 4e)

3d

  • Opens the print menu of your computer.

4

  • When you move the mouse over the mouseover element images/download/thumbnails/251037660/mousover_annotieren-version-1-modificationdate-1517404424000-api-v2.png a submenu will appear with commands for editing the line chart (section).

  • Standard setting is the Pencil mode.

  • You can activate the control and edit points by clicking on your annotation (comment).

  • You can transform or turn your annotation using the control and edit points.

  • The positions 4a to 4e describe further ways you can edit your annotations.

4a

  • Adds to the line chart a Form Element or Text Element.

  • The system provides various form elements.

  • Text elements can be edited by clicking on the Text.

4b

Changes on your annotation:

  • the mode (pencil, line or arrow).

  • the color (applies to form and text elements).

  • the size (applies to form and text elements).

  • the opacity (applies to form and text elements).

  • Back - Undoes the last command.

  • Restore - Restores an undone command.

4c

Saves your line chart (with annotation) in the formats:

  • PNG

  • JPG

  • SVG

  • PDF

4d

  • Prints your line chart.

4e

  • Undoes the command Annotate.

  • Switches to the live view of your line chart.

5

  • To see the display Measurement Value at a particular Timepoint, hold the mouse cursor over the line chart.

  • Shows the measurement values of the quantity in the set frame color (cf. Pos. 22).

  • Shows the Timepoint in a frame with red background.

  • You can "zoom" into the display of the quantities (red area in the above screen grab) by pulling the mouse cursor while holding down the button over a certain area of the line chart.

6

  • Symbols and colors used for showing the quantities and measuring devices in the line chart.

7

  • Selection of the Widgets (visualization).

  • Line Chart (Live) selected.

8

Selection of the view of the quantities in the line chart (live):

  • Not compressed - The line chart shows the quantities in a time interval as a section on a time scale. The starting point for the interval moves as the duration increases.

  • Compressed - The line chart shows the quantities in a time scale. The display of the line chart has a fixed starting point.

9

Color of the area under the quantity curve:

  • Not filled - transparent.

  • Half filled - 50% transparent.

  • Filled - full-color.

10

  • Deactivated - The line chart shows a new Y-axis for each quantity.

  • Activated - The line chart shows all quantities unified in one Y-axis (overlapping).

11

  • Selection of the first device.

12

  • Selection of a quantity, of the previously selected device.

13

  • Selection of the second device.

14

  • Selection of a quantity, of the previously selected device.

15

  • Selection of the third device.

16

  • Selection of a quantity, of the previously selected device.

17

  • Selection of the fourth device.

18

  • Selection of a quantity, of the previously selected device.

19

  • Selection of the fifth device.

20

  • Selection of a quantity, of the previously selected device.

21

  • Creates a new device (with quantity selection) to display in the line chart (live).

  • Configuration of up to 10 devices (with their respective quantity selection).

22

Selection of the quantity color in the line chart.

  • RGB and Hex entry.

  • Color spectrum slider.

  • Color suggested is the last selected color.

  • Save your color configuration in the color picker by clicking on the save symbol (

    images/download/thumbnails/251037660/speichern-version-1-modificationdate-1517404424000-api-v2.png

    ).

23

  • Closes the assistant Edit Widgets without saving the entries.

24

  • Saves your configuration.

  • The Widget appears on the Dashboard.