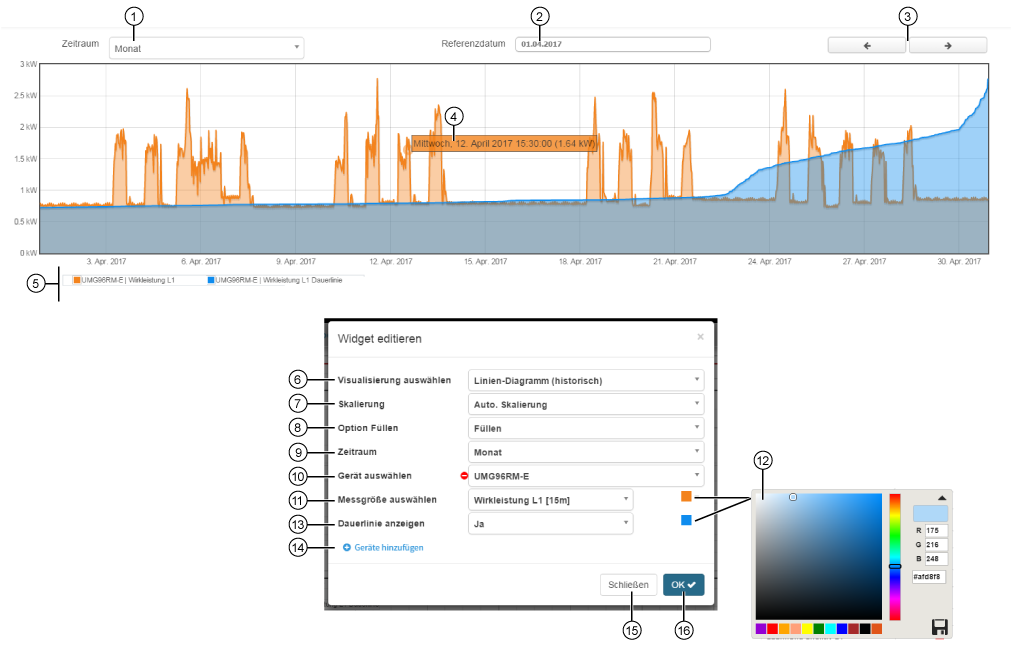
Line Chart (Historical)
|
Position |
Description |
|
1 |
|
|
2 |
|
|
3 |
|
|
4 |
|
|
5 |
|
|
6 |
|
|
7 |
Units in which the line chart displays your quantity:
|
|
8 |
Color of the area under the quantity curve:
|
|
9 |
|
|
10 |
|
|
11 |
|
|
12 |
Selection of the quantity color in the line chart.
|
|
13 |
The duration curve makes the frequencies of high and low measurements visible. Settings:
|
|
14 |
|
|
15 |
|
|
16 |
|