Master Page and Data Objects
![]()
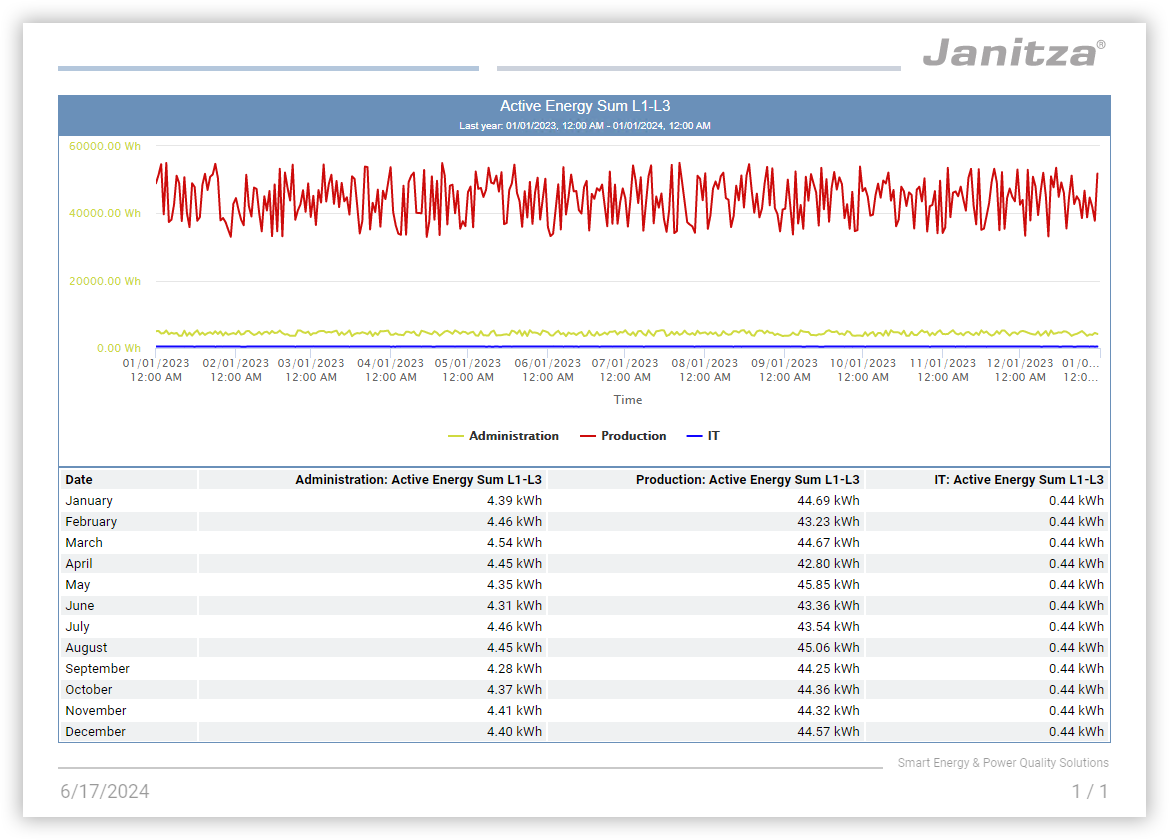
Application Example
In this application example, a report page is created showing the applied active energy of the past year for three areas of the company. The report also includes a global header and footer.
Preparation
Make sure that all the measured values you want to use are available in GridVis Web. If necessary, use the Data Import (DI) .
If necessary, upload images or logos via the Picture Manager .
Bear in mind that settings such as the aggregation depend on the desired application purpose. Deviate from this example as needed.
Getting Started
Create a new report and name it.
Set the report period to Last year.
Set the page format to Landscape A4.
Note
Activate the grid to arrange objects easily and accurately.
Use the object colors in the report settings to customize the report to suit your company CI.
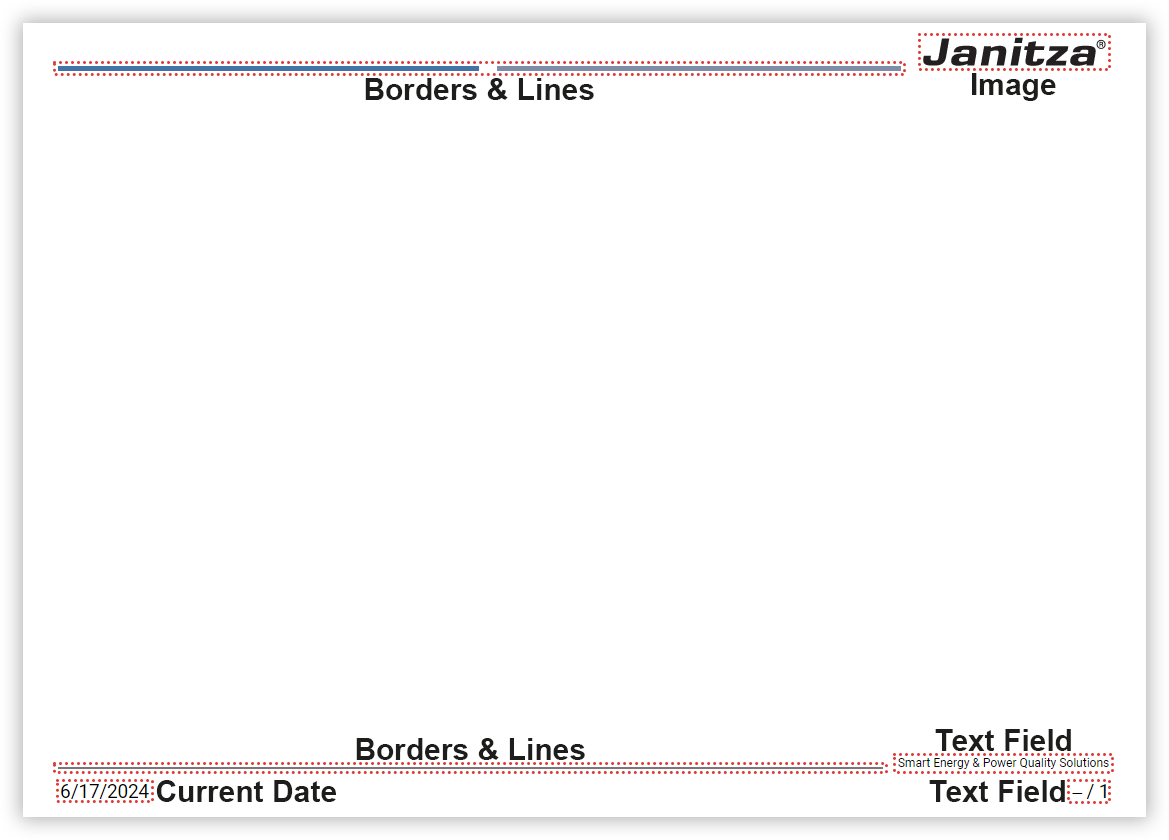
Header and Footer
Arrange the header or footer on the master page. In the report navigator, click Master Page , to add and edit objects.
Header
Set colorful accents with the object Borders & Lines. You need a separate object for each color.
Activate only the bottom edge of the object to display a simple line.
Use the object height to set the distance to the top of the page.Place your company logo using the image object.
Footer
Delimit the footer with a line.
In the object Borders & Lines , activate only the top edge of the object to display a simple line.
Use the object height to set the distance to the bottom of the page.Place your company claim using a text box on the right side of the footer.
Set the text alignment to right justified.Place the date in the lower left corner using the object Current Date.
Place the page number with the total number of pages in a text object in the lower right corner.
Set the text alignment to right justified.
Use the codes of the dynamic content and enter ##page / ##pageTotal.
Note
Objects of the master page are displayed pale when editing on the other pages. The appearance of colors is as vivid in the created report as on the master page.
Use meaningful object names for a clear object list.
For dynamic content like the page number, keep in mind that its size changes. Plan sufficient space in the associated objects.
If the report is to be printed, take the non-printable page areas into account in your printer settings.
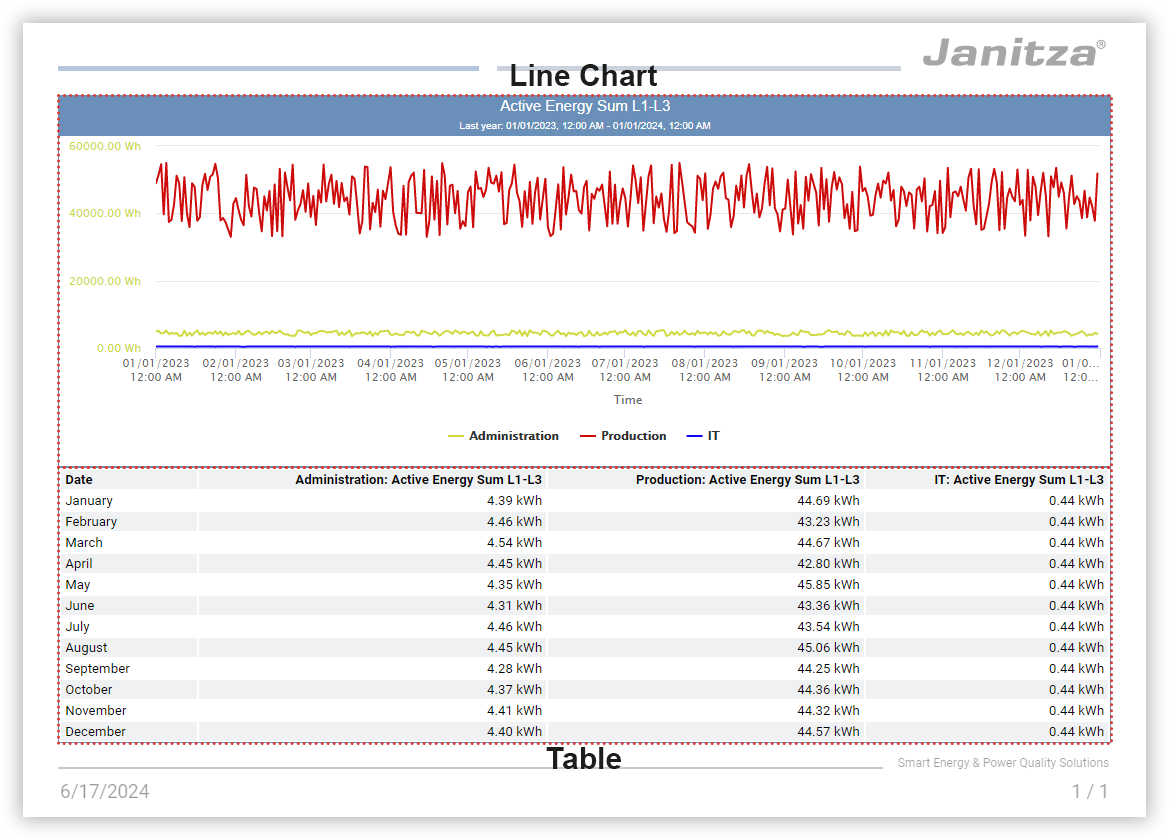
Data Objects
Go to the Report Page , to add and edit the data objects.
The active energy is shown in the upper half of the page as a progression over the report period. The lower half of the page gives the monthly values as a table.
Place a line chart on the top half of the page. Arrange it so that it fills the desired page width.
Activate the display of the title and status bar and the frame.
Enter the measurement value name as the object name to use it as the heading of the chart.Select the measurement values to be displayed.
Configure the measurement values. Assign display names and different colors and use Straight as the drawing method.
Click Save, to add the measurement values to the chart.Activate display of the legend.
Check the distance to the header.
Place a table on the bottom half of the page. Arrange it so that it fills the desired page width.
Activate only the display of the frame.
In the text properties, set right-justified text alignment and alternating lines.
Select the measurement values to be displayed.
Configure the measurement values. Leave the display name blank so that the device and measurement value name is used automatically.
Click Save, to add the measurement values to the table.As the aggregation, set Month.
Check the distance to the footer.
Note
Use a meaningful page name for a clear report navigator.
Use meaningful object names for a clear object list.
If the report is to be printed, take the non-printable page areas into account in your printer settings.
Result
The objects are fully configured. Compare your page with the example.