Reports


Pages
Application Examples
Application for electricity tax refund

Valid for

GridVis editions

Software plattform

images/download/thumbnails/251037744/GridVis_Icons_Expert-version-1-modificationdate-1712840324000-api-v2.png

images/download/thumbnails/251037744/gv_web-version-1-modificationdate-1712840324000-api-v2.png

images/download/thumbnails/251037744/Icon_Video-Tutorial-version-1-modificationdate-1712840380000-api-v2.png


Necessary rights

The different actions in the report editor require different rights. You grant these rights via the respective roles of a user in the user management .

Action / Role

View

Create

Update

Delete

View report

images/s/-7s3ptd/9012/agikpb/_/images/icons/emoticons/check.svg


Delete report

images/s/-7s3ptd/9012/agikpb/_/images/icons/emoticons/check.svg


images/s/-7s3ptd/9012/agikpb/_/images/icons/emoticons/check.svg

Create report

images/s/-7s3ptd/9012/agikpb/_/images/icons/emoticons/check.svg

images/s/-7s3ptd/9012/agikpb/_/images/icons/emoticons/check.svg

images/s/-7s3ptd/9012/agikpb/_/images/icons/emoticons/check.svg


Edit report

images/s/-7s3ptd/9012/agikpb/_/images/icons/emoticons/check.svg


images/s/-7s3ptd/9012/agikpb/_/images/icons/emoticons/check.svg


Export report

images/s/-7s3ptd/9012/agikpb/_/images/icons/emoticons/check.svg


images/s/-7s3ptd/9012/agikpb/_/images/icons/emoticons/check.svg


Import report

images/s/-7s3ptd/9012/agikpb/_/images/icons/emoticons/check.svg

images/s/-7s3ptd/9012/agikpb/_/images/icons/emoticons/check.svg

images/s/-7s3ptd/9012/agikpb/_/images/icons/emoticons/check.svg


Create PDF

images/s/-7s3ptd/9012/agikpb/_/images/icons/emoticons/check.svg

images/s/-7s3ptd/9012/agikpb/_/images/icons/emoticons/check.svg


View PDF

images/s/-7s3ptd/9012/agikpb/_/images/icons/emoticons/check.svg


Delete PDF

images/s/-7s3ptd/9012/agikpb/_/images/icons/emoticons/check.svg


images/s/-7s3ptd/9012/agikpb/_/images/icons/emoticons/check.svg


Opening the report management

  • Click on the Reports button in the navigation bar.

  • Click on the entry Reports in the Navigation menu.
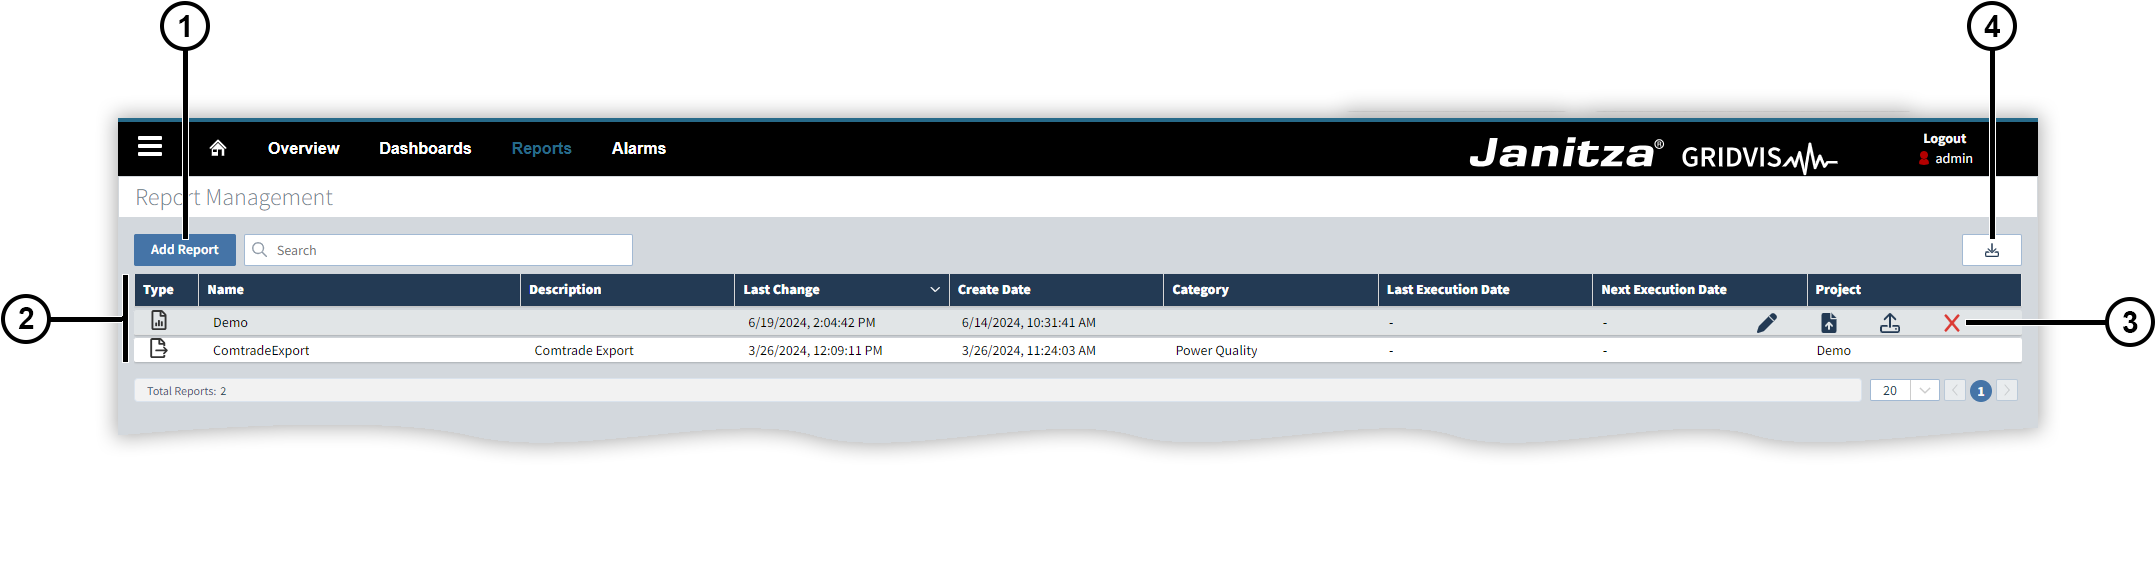

Report management

The report management displays reports and data exports from all projects that have been added to the GridVis Web.

images/download/attachments/251037744/Berichte-Berichtsverwaltung-en-version-1-modificationdate-1729684356000-api-v2.png

Position

Description

1

Opens a new report in the report editor . You can start with an empty report or use a report template .

2

Contains details of your reports or data exports (GridVis Desktop).
Click on an entry in the report list to view, download or delete the documents of this entry stored so far in the database in a new window that opens.

Note

  • Description

    • For reports, a description can be included in the report settings .

    • For data exports, the description corresponds to the name of the report, e.g. Utilization Report or RCM Report.

  • Category

    • Reports cannot be assigned to a category.

    • Categories are assigned automatically for data exports. The category to which the data export is assigned in GridVis Desktop is used here.

3

images/download/thumbnails/251037744/pen-solid-version-1-modificationdate-1729673327000-api-v2.png Opens the report in the report editor . Data exports are processed in the GridVis desktop (see data exports ).

images/download/thumbnails/251037744/file-arrow-up-solid-version-1-modificationdate-1729673355000-api-v2.png Creates the report.

images/download/thumbnails/251037744/upload-regular-version-1-modificationdate-1729673375000-api-v2.png Exports the report in the JSON format.

images/download/thumbnails/251037744/x-solid-red-version-1-modificationdate-1729673400000-api-v2.png Deletes the report or data export including all related documents.

4

Imports a report in the JSON format.

Note

  • As long as the report has not been opened for editing after importing, it is not assigned to any project.

  • When edited for the first time, the device exchange window opens, which you can use to assign a device from the currently used project to each of the devices in the report.

  • All pictures used in a report are included in the export. When importing a report, the system checks whether these pictures already exist in the picture database . Existing pictures are used from the picture database. Non-existent pictures are loaded into the report during the import, but are not added to the picture database.


Report templates

Report templates can be used as the basis for new reports. Various pre-installed templates are available in the GridVis Web.
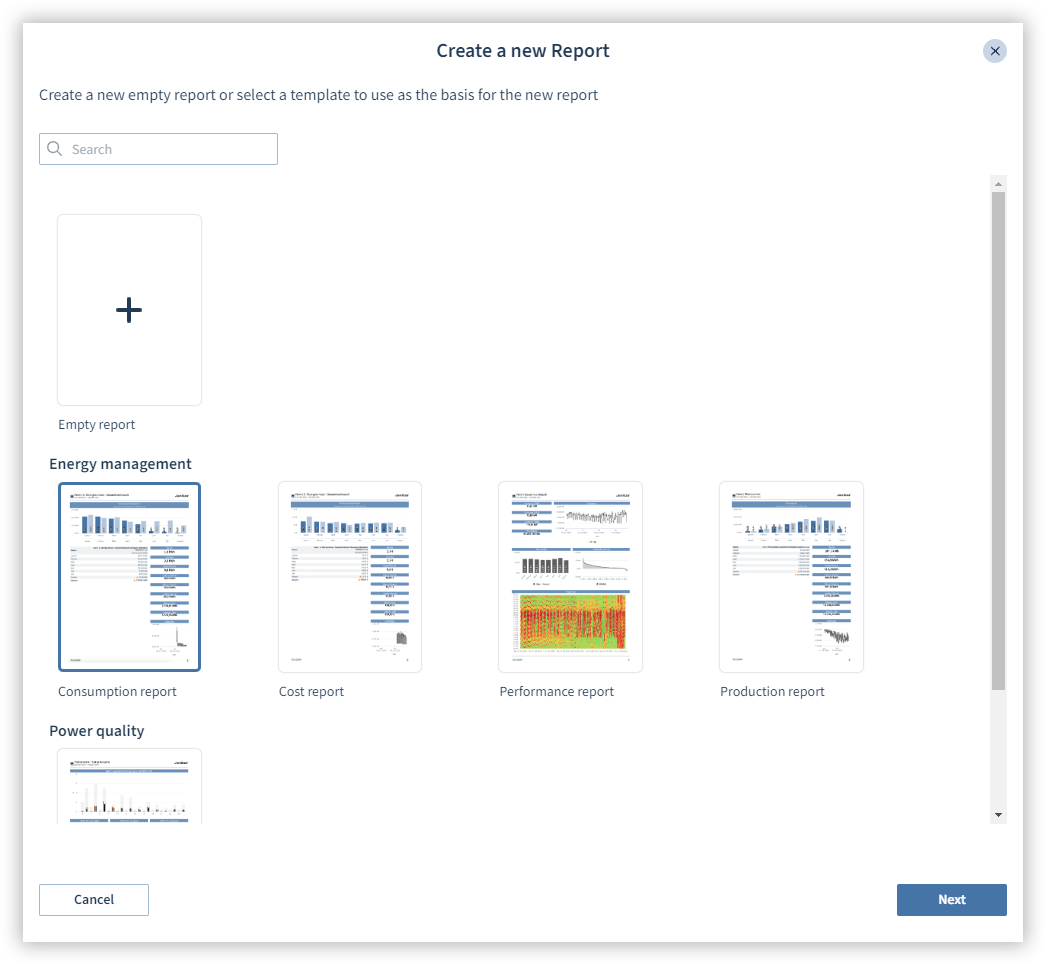
images/download/attachments/251037744/Berichte-Neuer-Bericht-en-version-1-modificationdate-1729684785000-api-v2.png

Select a template:

  1. Click on the Add Report button.

  2. Select a template.

  3. Select the devices you want to use in the template.

  4. Configure further settings.

  5. Click on Submit. You can further adjust the report if needed.
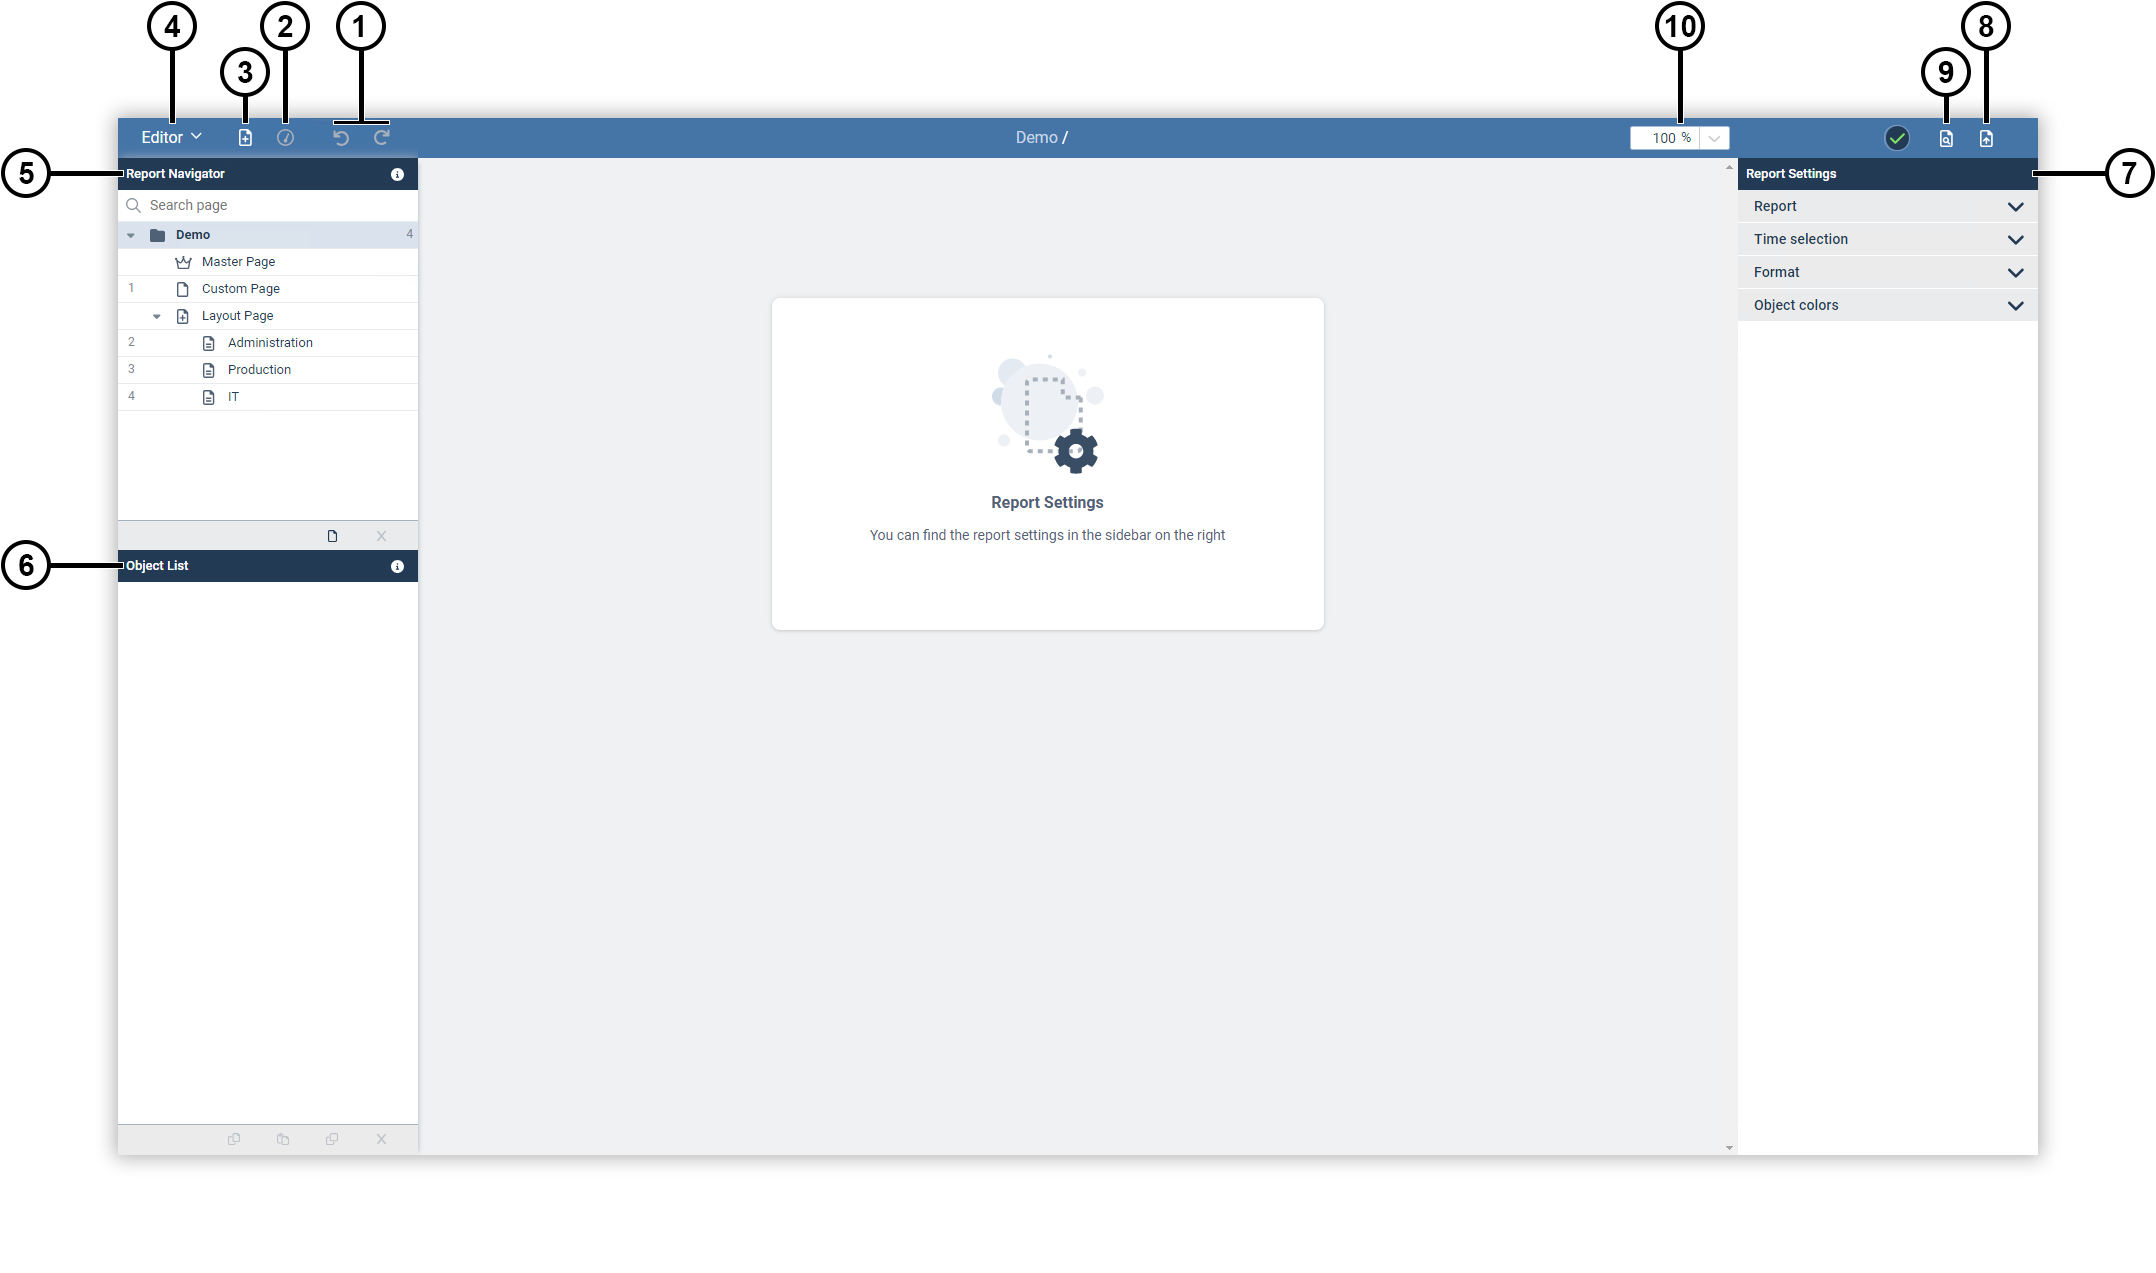

Report editor

Start the report editor by either creating a new report or editing an existing report.

The report editor allows you to create reports with your own layout, content and design. Freely place elements with measured values, images or graphical components. These elements are called objects .

images/download/attachments/251037744/Berichte-Berichtseditor-en-version-1-modificationdate-1729685020000-api-v2.png

Position

Description

1

Undoes or redoes actions (keyboard shortcut Ctrl/cmd + Z or Ctrl/cmd + Y).

2

Opens the object library, which can be used to add an object to the currently displayed page.

3

Adds a new page or layout page to the report.

4

Opens the menu with further options such as device exchange.

5

Manages the pages of the report. More information can be found under report navigator .

6

Manages the objects of the displayed page. More information can be found under object list .

7

Changes the settings for the selected element. For more information, see the explanation of the respective element.

8

Generates the report as a PDF and stores it in the database.

9

Creates a preview of the report as a PDF. You can download the preview, but it will not be saved in the database.

10

Zooms in the report editor.
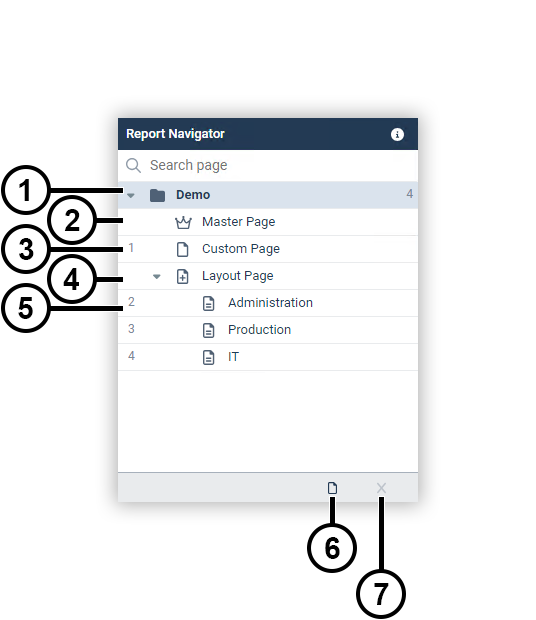

Report navigator

Use the report navigator to manage the pages of your report. You can change the arrangement of the pages using drag-and-drop.

images/download/attachments/251037744/Berichte-Berichtsnavigator-en-version-1-modificationdate-1729685097000-api-v2.png

Position

Description

1

Origin element of all report pages. Select this element to access the report settings in the settings menu. More information can be found under report settings .

2

The master page of the report. Select this item to access the master page settings in the settings menu. More information can be found under master page .

3

A report page. Select this item to access the page settings in the settings menu. More information can be found under page .

4

A layout page. Select this item to access the layout page settings in the settings menu. More information can be found under layout page .

5

A device page of a layout page. Select this item to display the device page. More information can be found under layout page .

6

Adds a new blank page to the report.

Note

  • You can only add a blank page using this item.

  • To add a layout page to the report, use the button Add new page to report (see report editor ).

7

Deletes the selected page.

Note
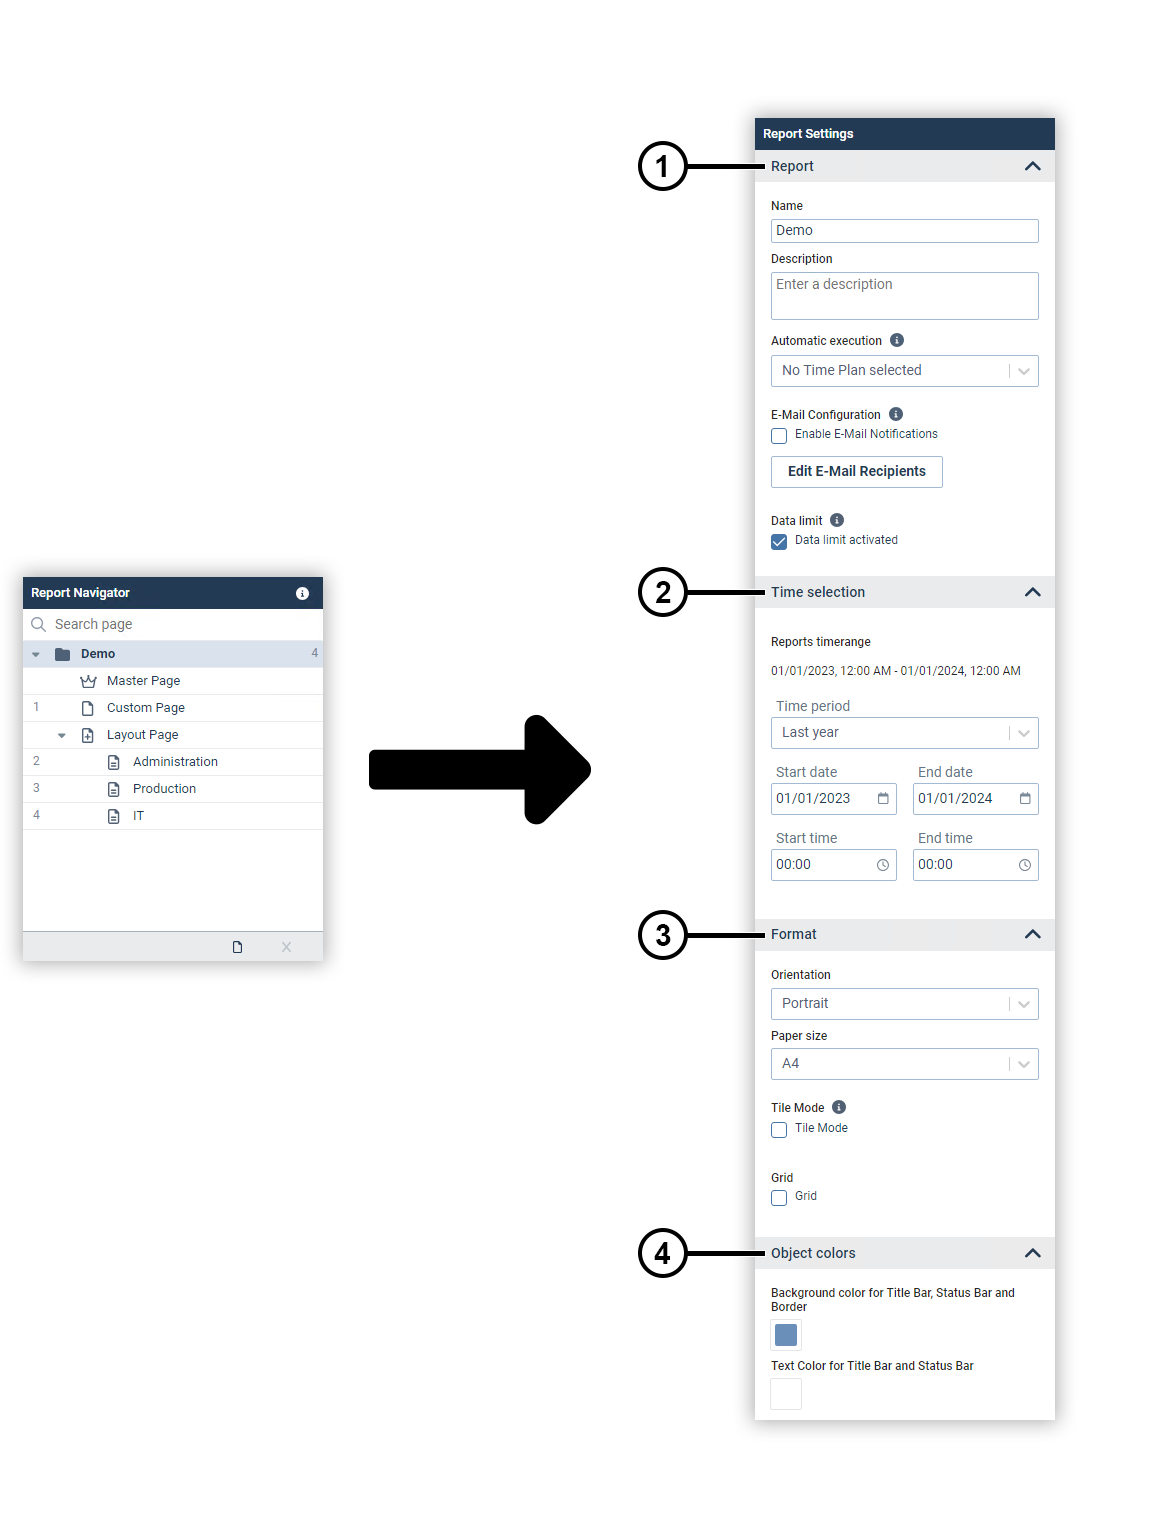
  • You cannot delete the master page.

  • When you delete a layout page, you automatically delete all the device pages that belong to it.

  • To delete individual layout device pages, remove the corresponding device from the layout page .


Report settings

Make the global settings for your report here.

images/download/attachments/251037744/Berichte-Berichtseinstellungen-en-version-1-modificationdate-1729685197000-api-v2.png

Position

Description

1

Report. You can assign a name and a description here. In addition, you can set the times at which the report is automatically executed and the recipients to whom the report is sent as an e-mail. The data limit prevents visualization objects from representing too many data points.

Note

  • The time instants offered can be modified as desired via the time management .

  • Automatic execution can be disabled using the option No schedule selected.

  • The email notification will only occur if a schedule has been selected for automatic execution.

  • An email server must be configured in the GridVis Web settings for sending emails (see GridVis Service ).

2

Time selection. M ake the global settings for historical values here.

3

Format. Set the format of the report here. You can use the tile mode and the grid as positioning guides. The grid does not appear in the generated PDF document.

4

Objekt colors . Set the background, text and border color of the report objects here.