Second Example of "CSV Import" (Energy Data)
Description
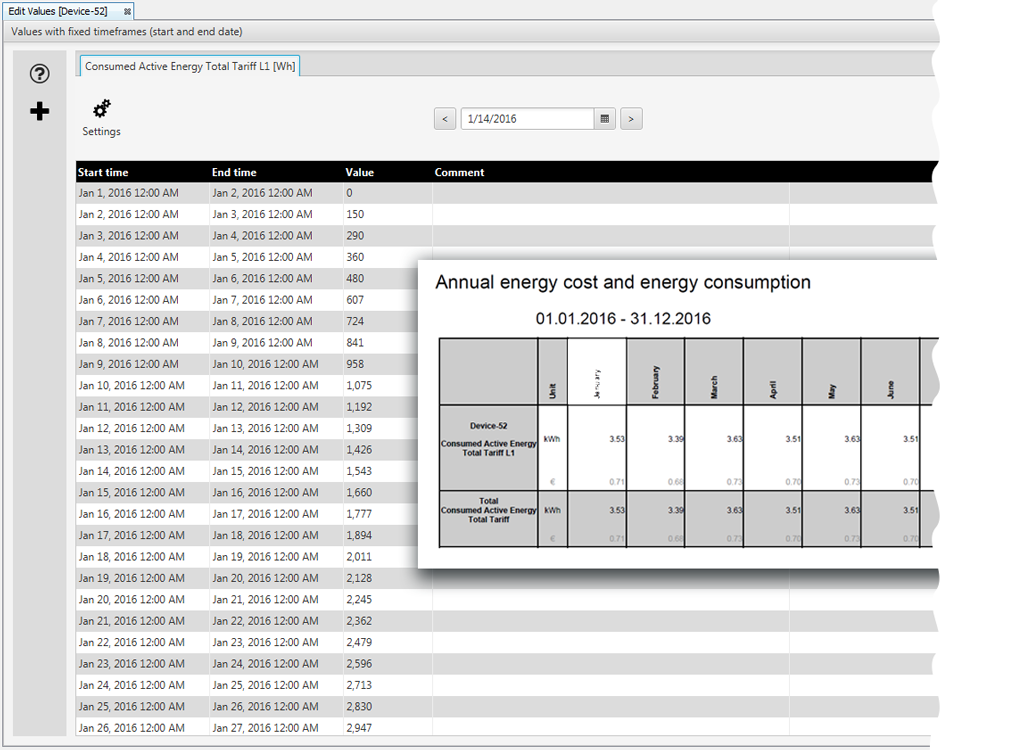
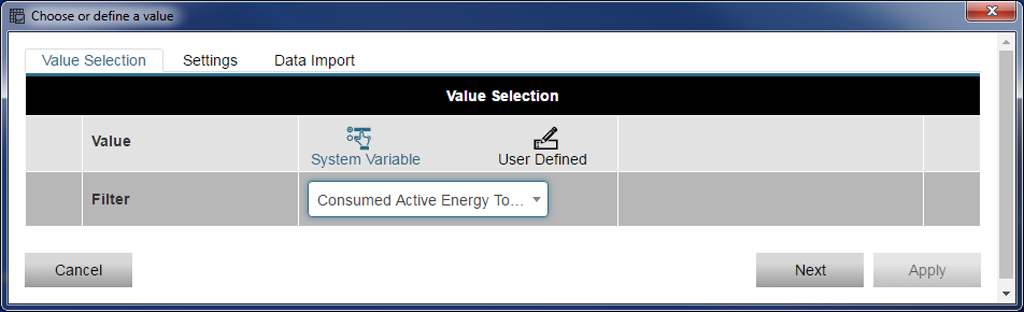
Energy values can provide important reference data for your energy costs and your energy consumption. The following is a data import Active energy drawn prepared in GridVis as an example for the CSV import of energy data:
First configure your device for the data import (DI) as described in Data Import (DI) - Configuration .
After that follow the example configuration.
|
Pos. |
Description of the CSV File formatting |
|
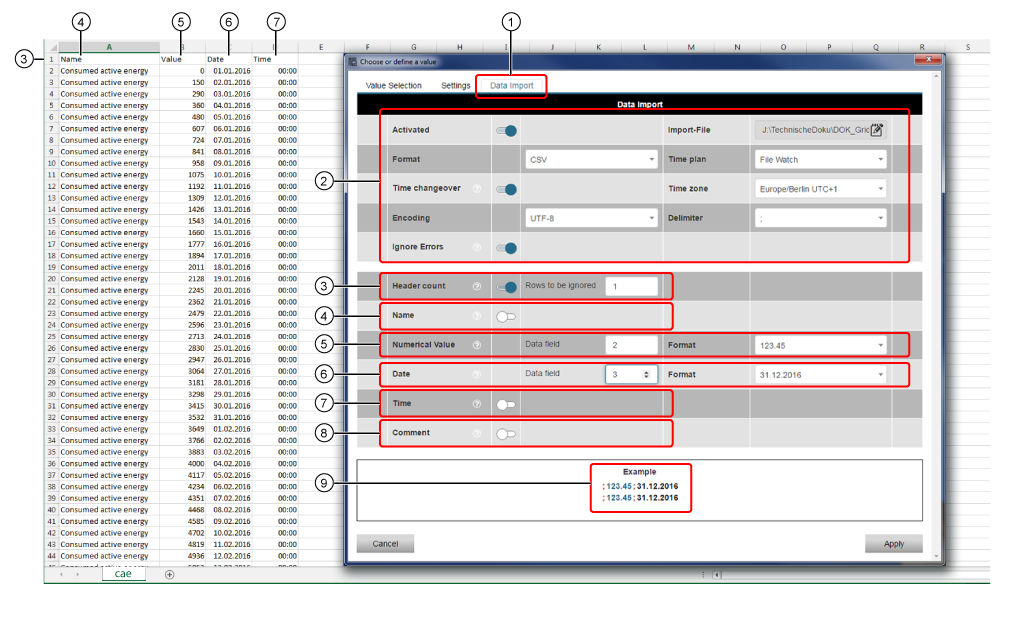
1 |
Register Data Import click on the register to activate it. |
|
2 |
The background shows the formatting of the CSV file. Example: CSV File to Download . |
|
3 |
Because the Rows to be ignored has the value 1, the header entries Name, Date, Time, Value will not be read. |
|
4 |
The Name (Active energy drawn) is not read. |
|
5 |
The Numerical Value is in the column 2 (Data field 2) of the CSV file. |
|
6 |
The Date is in the column 3 (Data field 3)of the CSV file. |
|
7 |
The Time is not read. |
|
8 |
The CSV file does not contain a Comment. The Comment is not read. |
|
9 |
The columns 2 and 3 are not read. All columns are separated by semicolons. |
Finally click on the button Apply to read in your configuration.
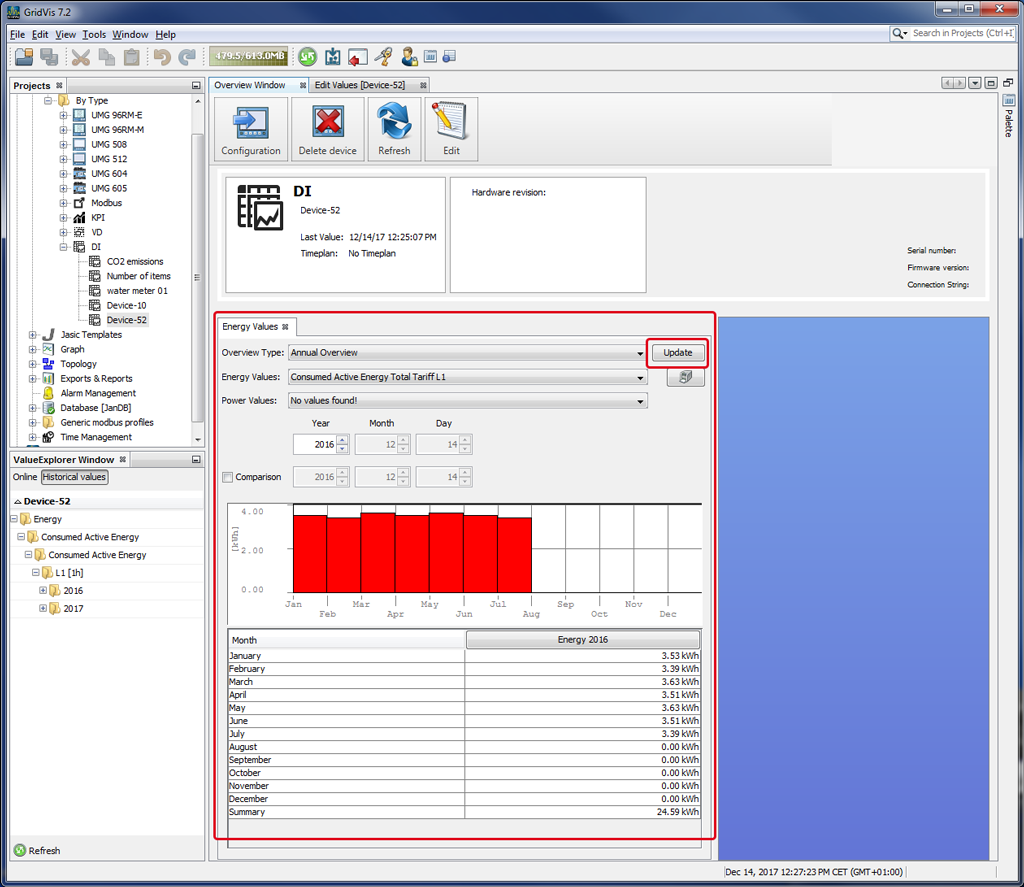
To analyze your data, the GridVis software has 3 ways of interpreting it:
1. Interpretation in the Overview Window
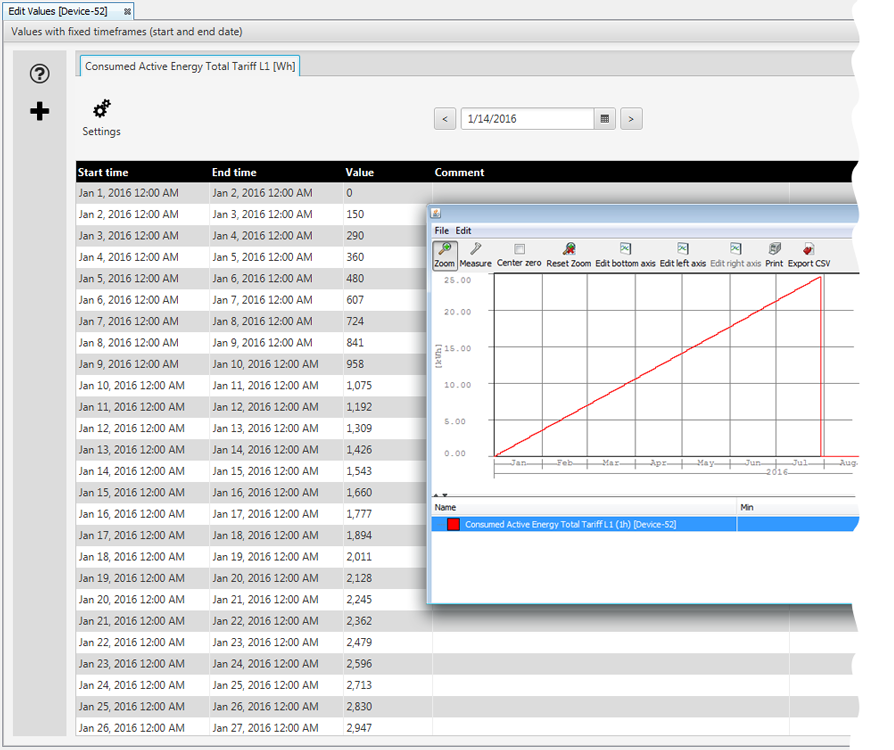
2. Interpretation in the Window of the Graph
Open your Historical Values in the value tree window.
Right-click on your value.
Select the entry Display in Graph in the context menu.
More analysis functions are available to you in the symbol bar of the graph.
3. Annual evaluation of the energy costs and consumption using the function Exports & Reports in the GridVis software (desktop):
In Exports & Reports in your GridVis project window, right-click on the context menu entry Create New Report.
In the window Select a Report click on the entry Annual Analysis of the Energy Costs and Consumption.
An assistant will guide you through the further configuration of your report.
For the output of your annual analysis, the GridVis software can provide several different file types (pdf, odt, html, xls).