Dashboards (as of GridVis version 9.0.0)
Dashboards without authentication
![]()
Opening the dashboard management
Click on the Dashboards button in the navigation bar.
In the Navigation menu, click on the entry Dashboards.
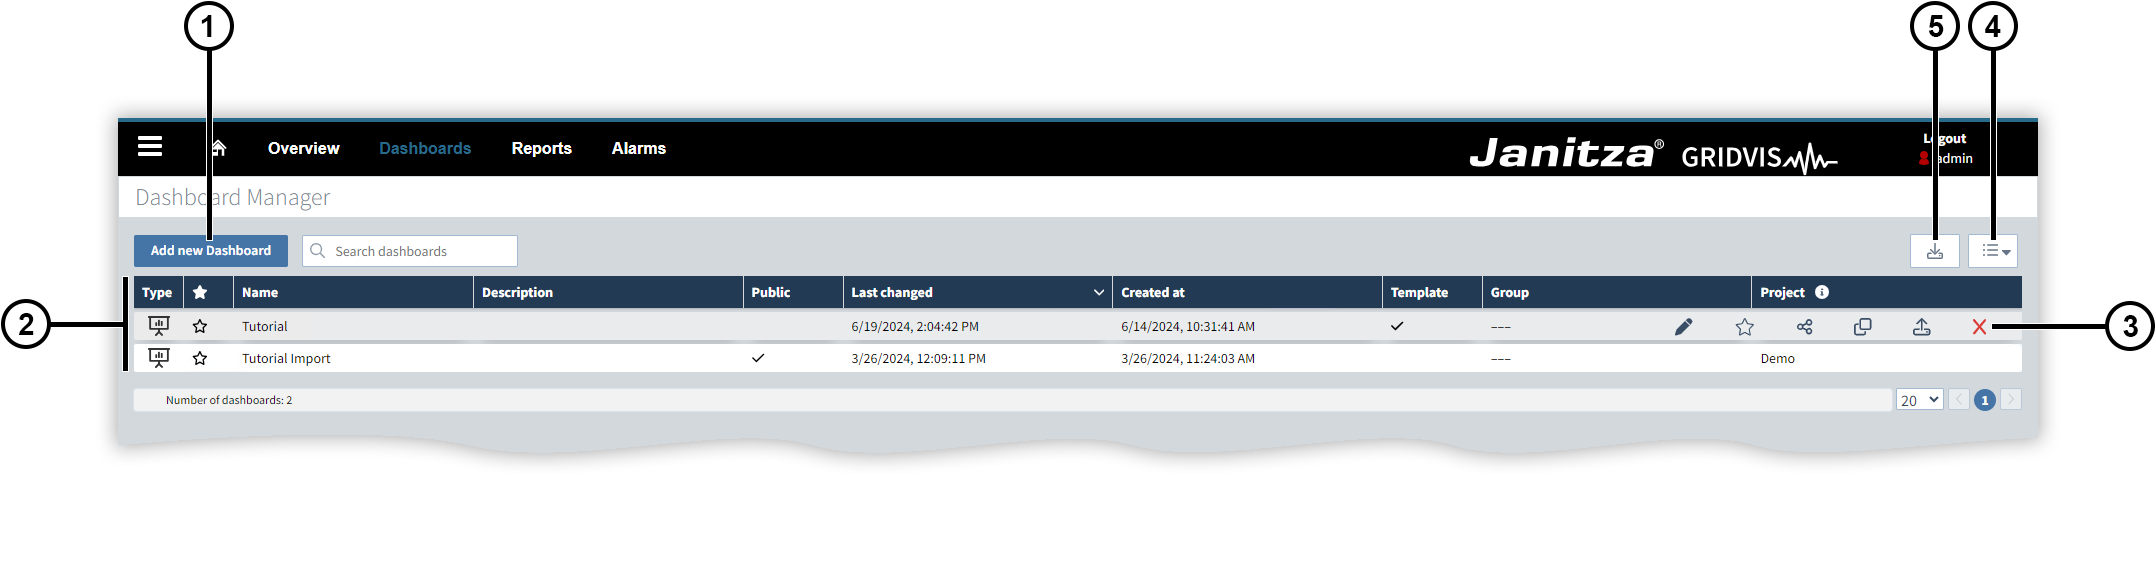
Dashboard management
The dashboard management displays the dashboards from all projects that have been added to the GridVis Web.
|
Position |
Description |
|
1 |
Opens a new dashboard in the Dashboard editor . You can start with an empty dashboard or use a Dashboard template . |
|
2 |
Contains information about your dashboards. |
|
3 |
|
|
4 |
Changes the view. Here you can display the dashboards of previous GridVis versions or open the previous graphical user interface (see Dashboards and templates up to GridVis version 9.0.0 ). |
|
5 |
Imports a dashboard in the JSON format. Note All pictures used on a dashboard are included in the export. When importing a dashboard, the system checks whether these pictures already exist in the picture database . Existing pictures are used from the picture database. Non-existent pictures are loaded into the dashboard during the import, but are not added to the picture database. |
Dashboard templates
Dashboard templates can be used as the basis for new dashboards. You can create your own templates from dashboards or use pre-installed templates.
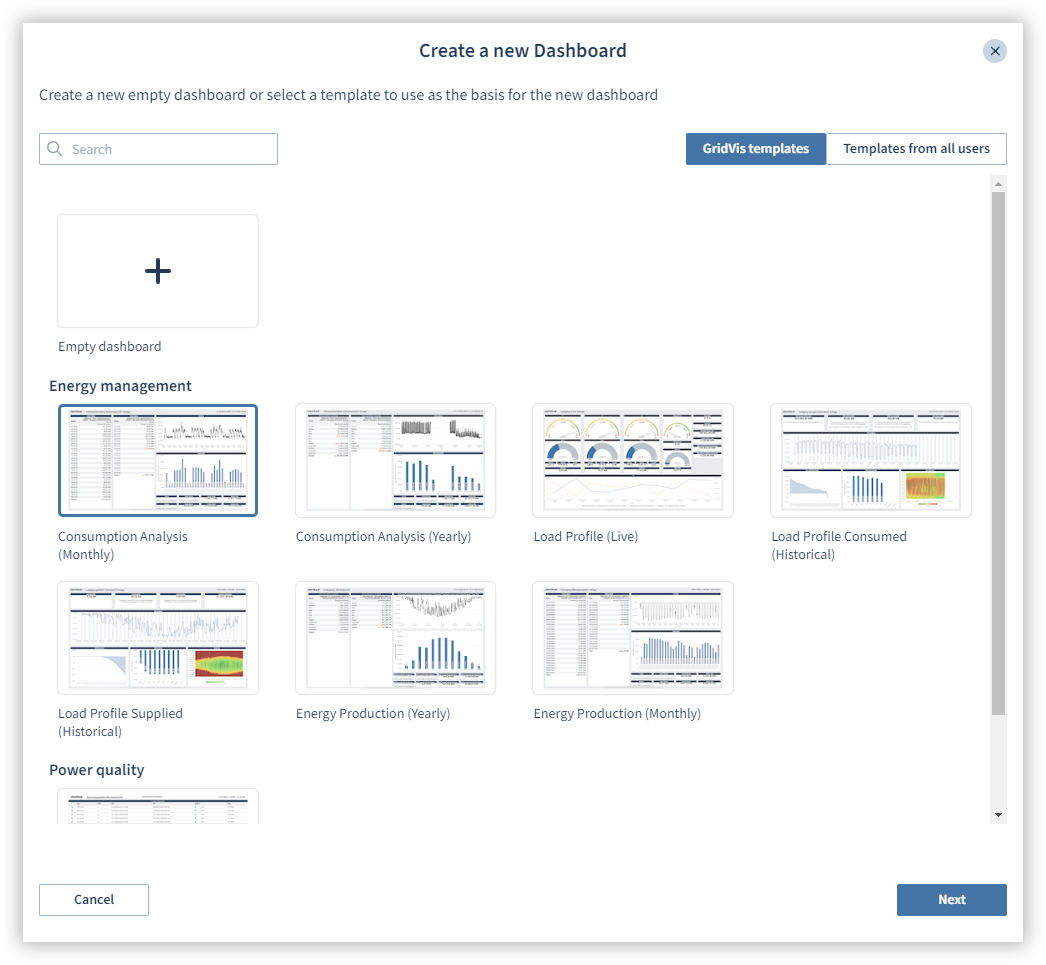
Select a template:
Click on the Add new dashboard button.
Select a template.
Under GridVis templates, you will find all the templates already contained in GridVis.
Under Templates from all users, you will find templates that have been created by you and other users.
Select the devices you want to use in the template.
Configure further settings.
Click on Submit. You can further adjust the report if needed.
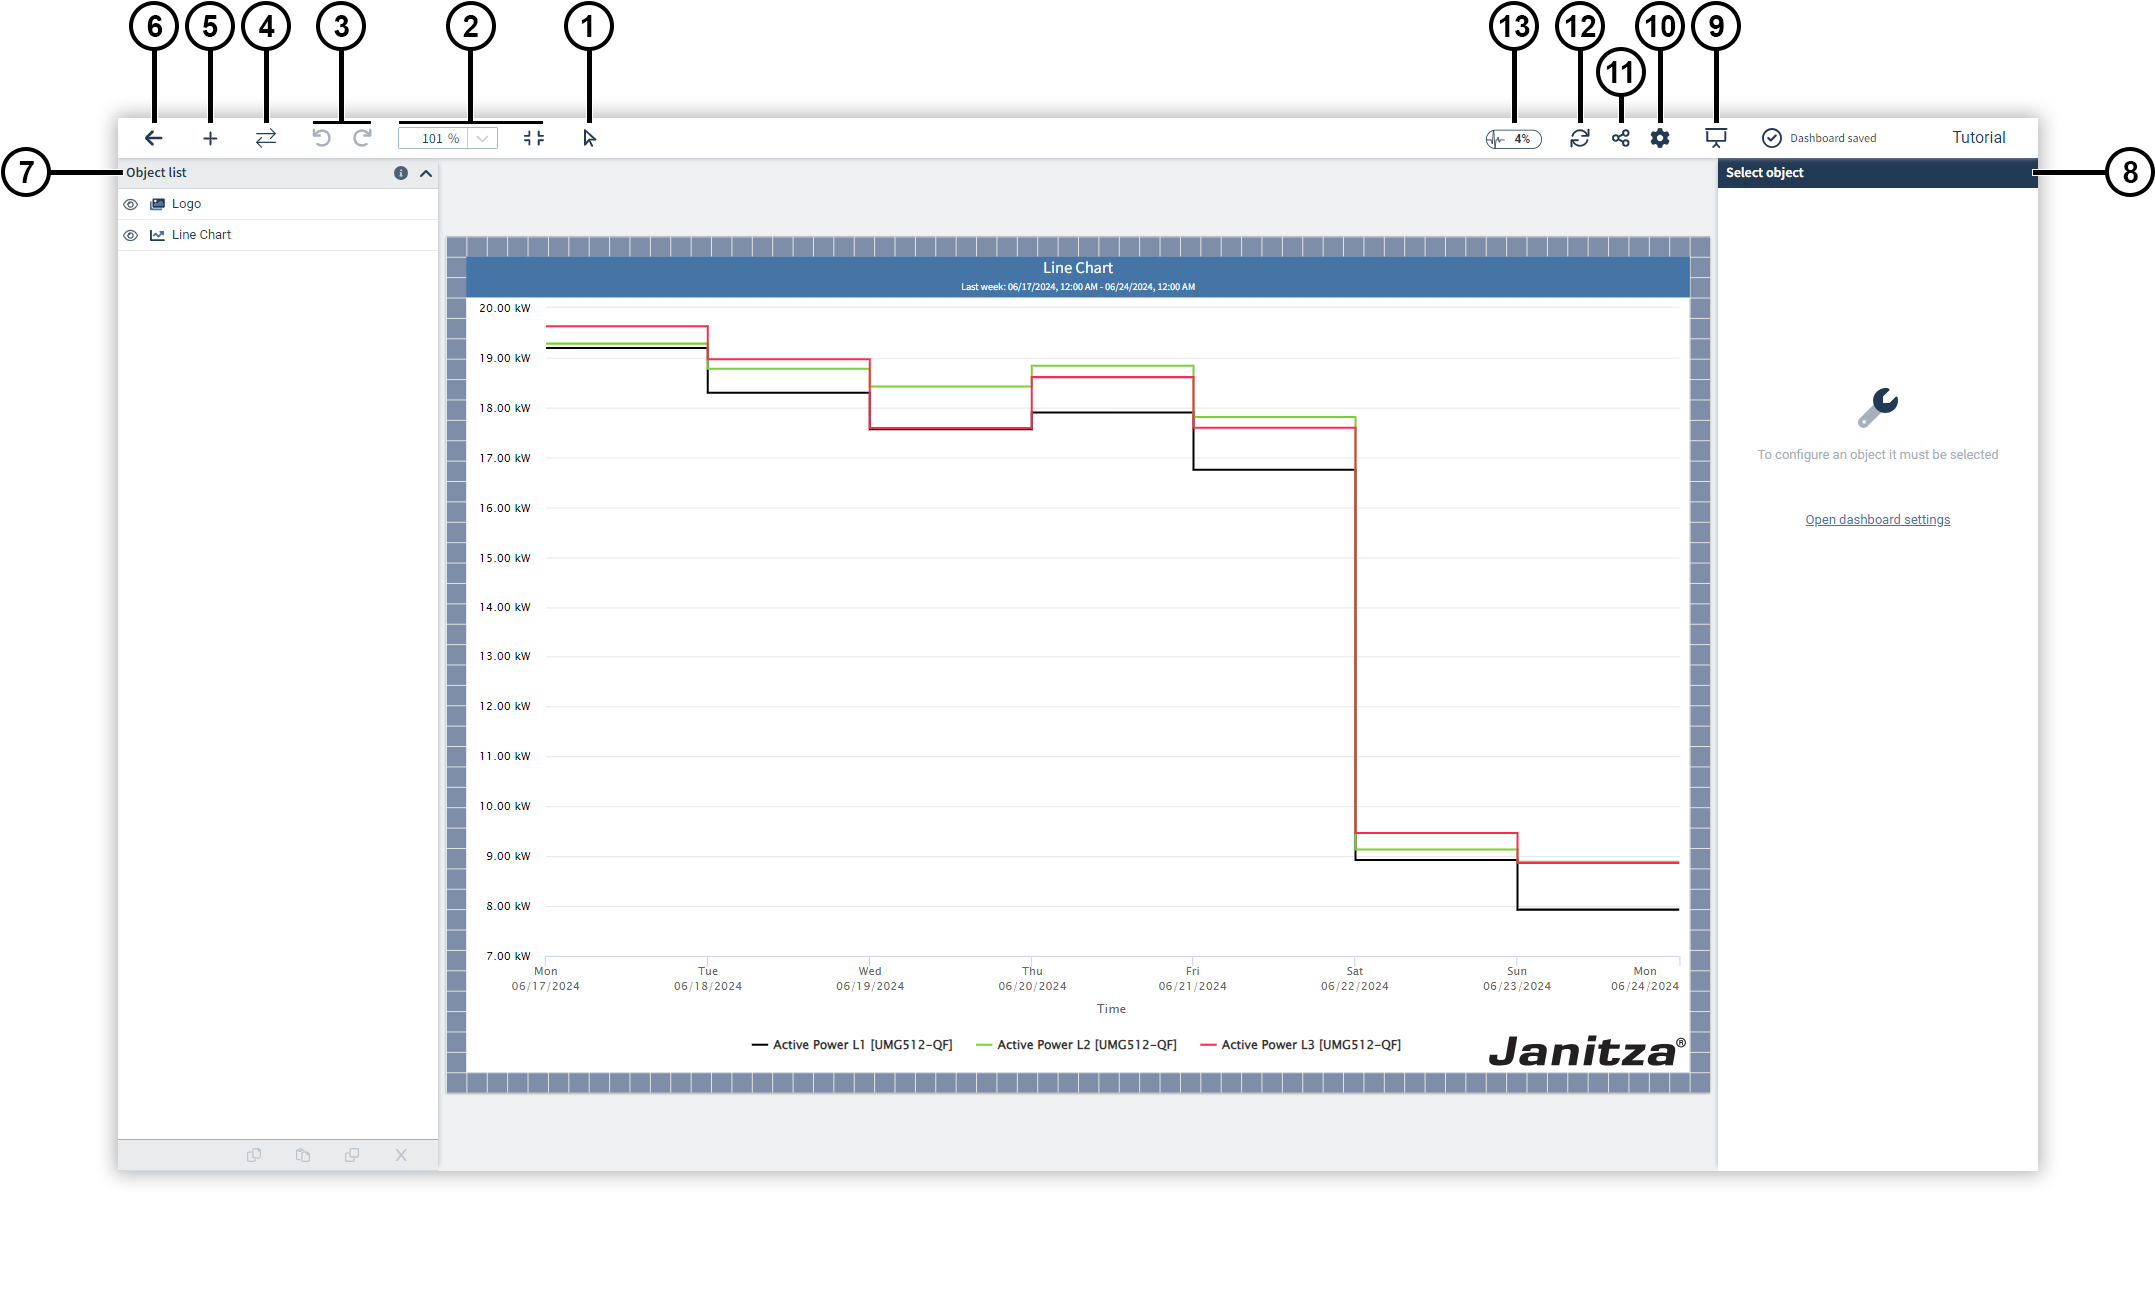
Dashboard editor
The dashboard editor allows you to create dashboards with your own layout, content and design.
Freely place elements with measured values, images or graphical components. These elements are called
Objects
.
|
Position |
Description |
|
1 |
Switches the panning mode. The mouse icon indicates that you are moving objects on the dashboard. The hand icon indicates that you are navigating in the editor. |
|
2 |
Zooms in the dashboard or adjusts the dashboard to the window size so that it completely fills the workspace. |
|
3 |
Undoes or restores actions (shortcut Ctrl/cmd + Z or Ctrl/cmd + Y). |
|
4 |
Swaps the devices in all objects using the device swap function. |
|
5 |
Opens the object library, which you can use to add Objects to the dashboard. |
|
6 |
Switches to the Dashboard management . |
|
7 |
Manages the objects. More information can be found under Object list . |
|
8 |
Changes the settings for the selected element. This window displays the Dashboard settings as well as the settings of objects that are selected. |
|
9 |
Opens the dashboard in Presentation mode . |
|
10 |
Opens the Dashboard settings . |
|
11 |
Shares the dashboard publicly. |
|
12 |
Reloads the dashboard to refresh the displayed data. |
|
13 |
Displays the current utilization of the dashboard. |
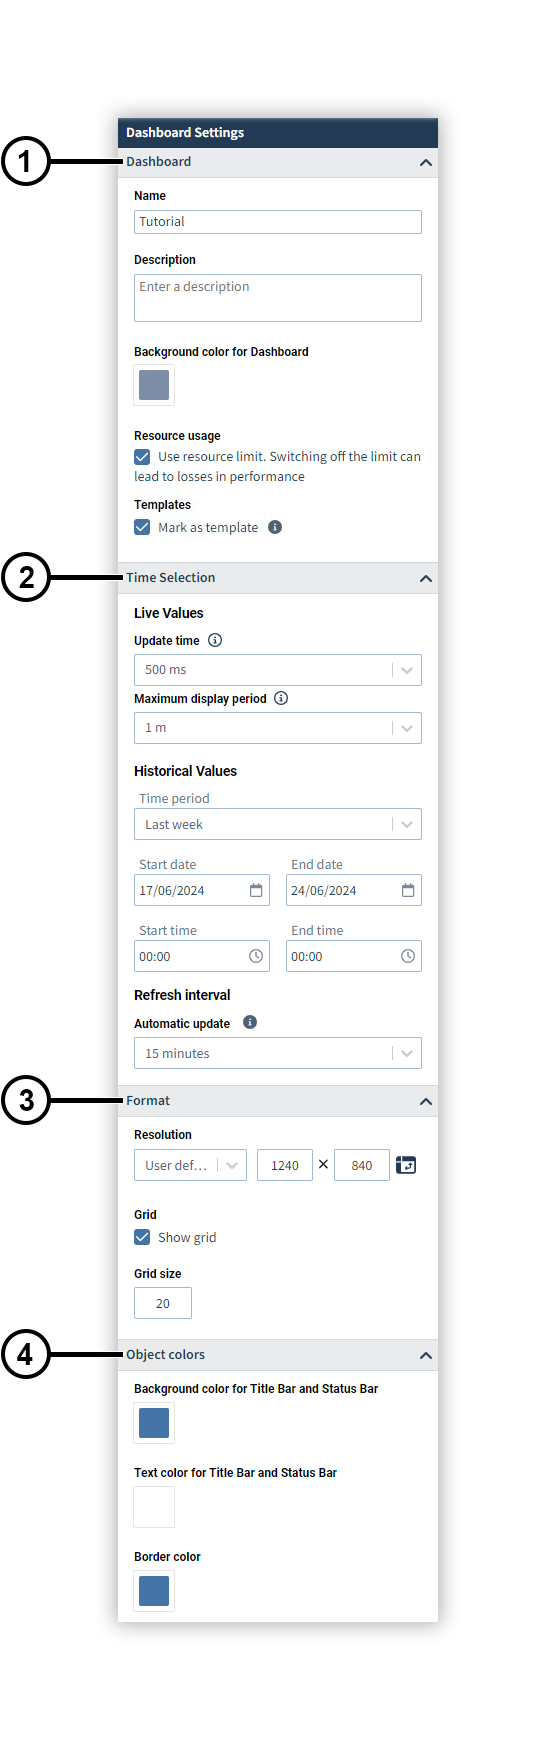
Dashboard settings
Make the global settings for your dashboard.
|
Position |
Description |
|
1 |
Dashboard. You can assign a name and description here and change the background color of the dashboard. In addition, you can deactivate the setting here that prevents further objects from being added if the workload is too high. Turning off this limitation can have a negative impact on the performance. You can also mark the dashboard as a template. |
|
2 |
Time selection. Make the global settings for live and historical values here. In addition, the time interval at which the dashboard is refreshed can be specified for the Presentation mode . |
|
3 |
Format. Set the format of the dashboard and the grid size here. You can disable the display of the grid. The grid is used as a positioning aid and is not displayed in presentation mode. |
|
4 |
Objekt colors. Set the background, text and border color of the dashboard objects here. |
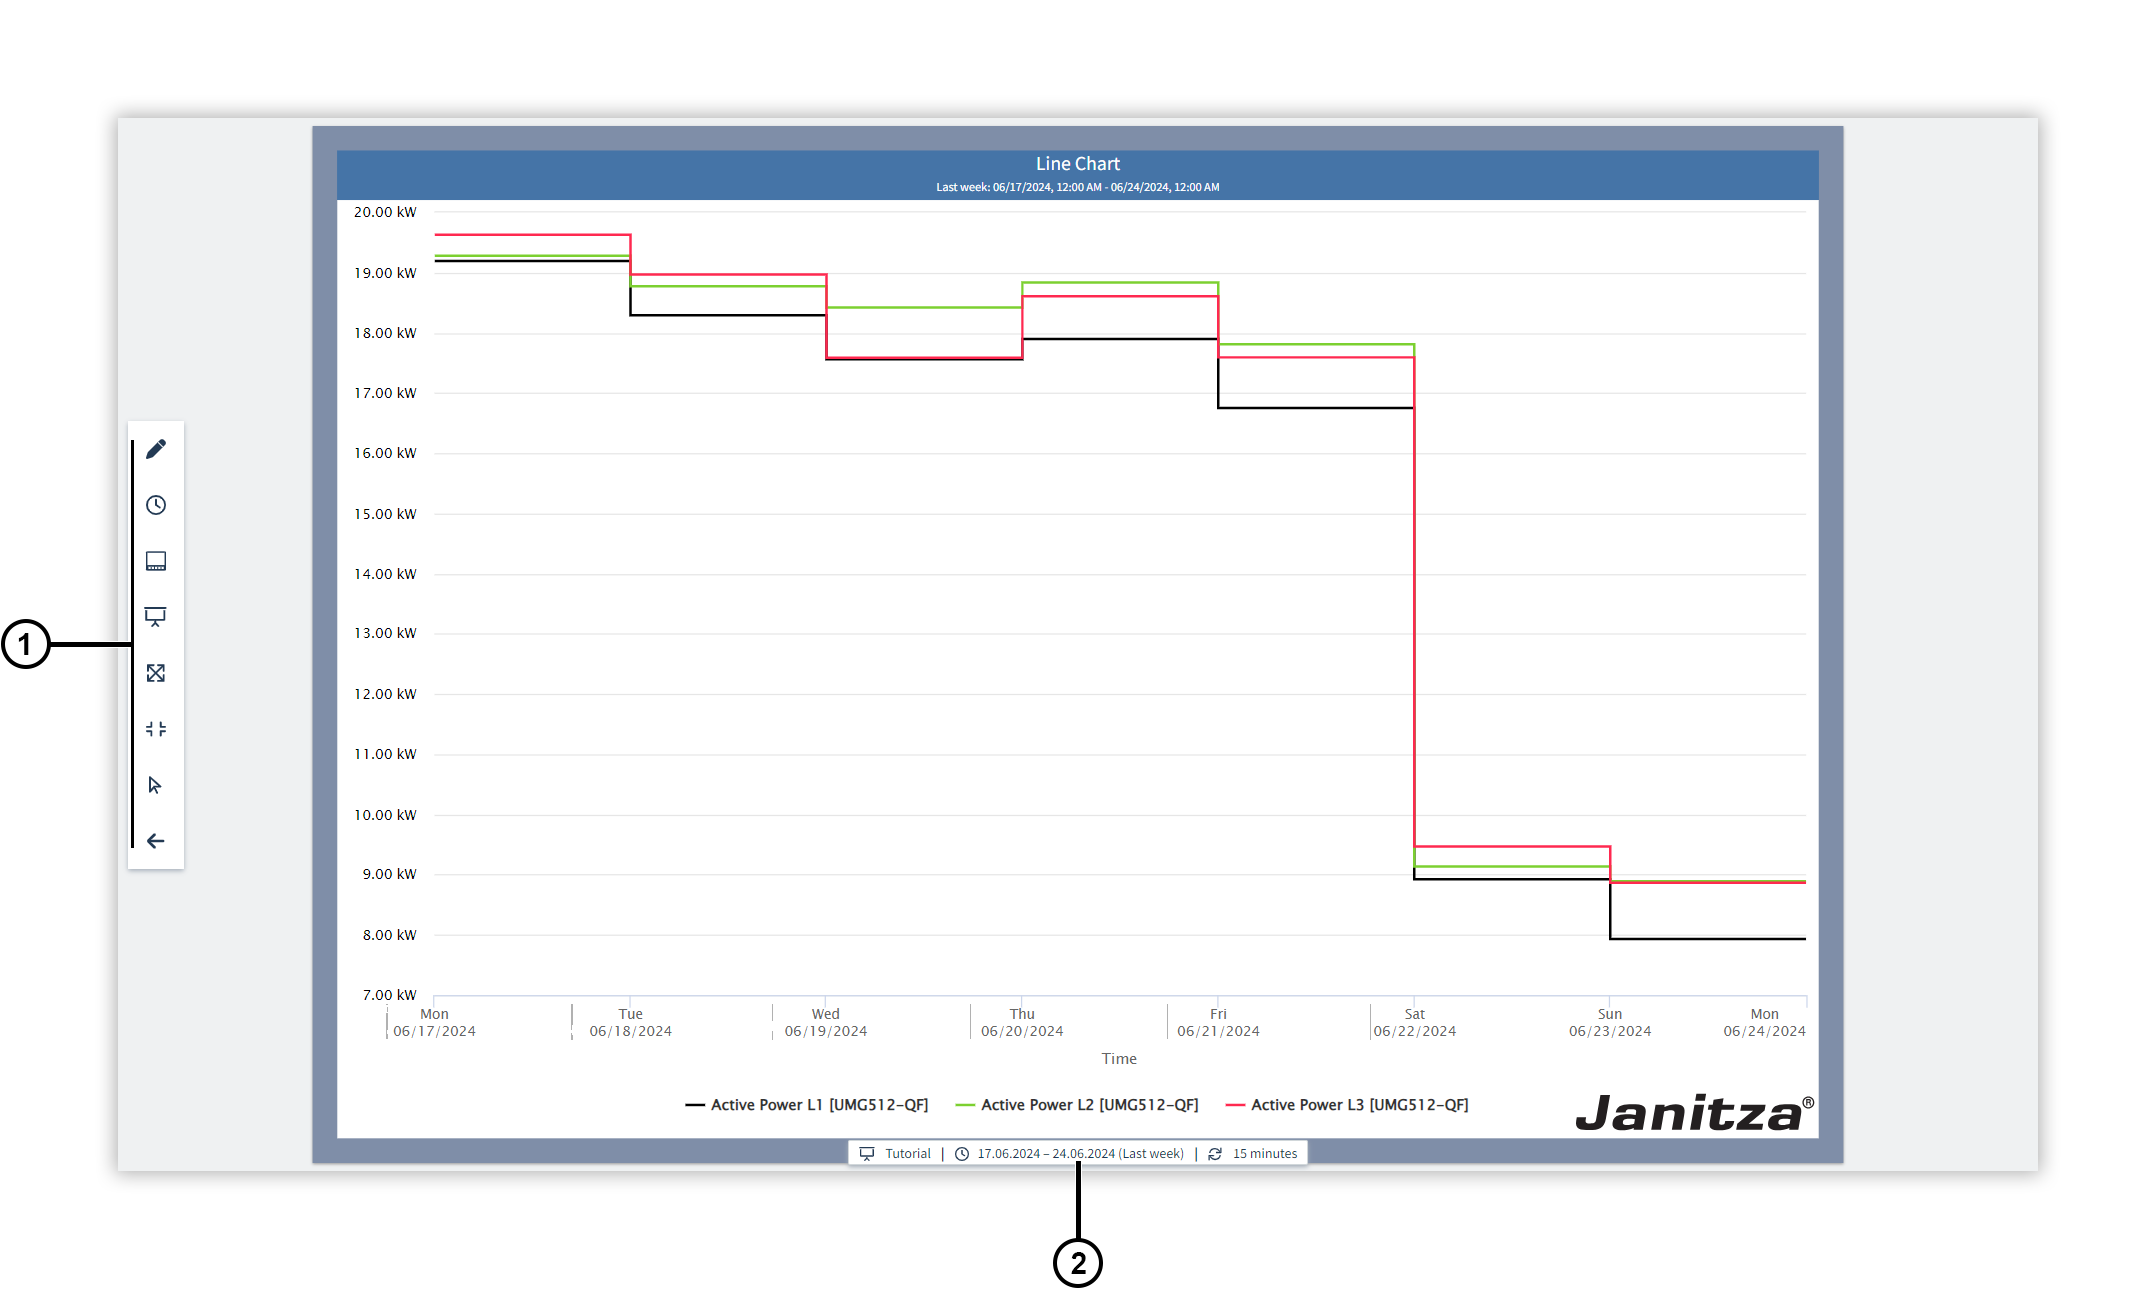
Presentation mode
The presentation mode is used to display the dashboard elsewhere, for example on a separate monitor.
|
Position |
Description |
|
1 |
|
|
2 |
Displays information about the dashboard. Here you can see which dashboard is being presented with which time setting and at which time interval the dashboard is refreshed. You can also reset temporary time setting changes or swapped devices. |